KPI Monitoring rApp
The KPI Monitoring rApp is an open-source Non-RT RIC application for monitoring a live OCUDU 5G network over standard O-RAN interfaces. It turns the O1 performance stream of each gNB into cell, gNB and UE KPIs, raises threshold alerts, and exposes both to other rApps over R1. It also manages the O-RUs behind each gNB over the O-RAN M-plane, through the SMO SDNR controller.
The rApp runs on the same TOSSI Open RAN O1 Stack as the Cell Congestion Optimization rApp: an OCUDU RAN, the OCUDU O1 Adaptor and the OCUDU NETCONF server, managed by an ONAP-based SMO and the O-RAN Software Community Non-RT RIC. Where the congestion rApp closes a control loop, this rApp gives operators a single view of the RAN and its radios, covering live KPIs, alarms, timing state and a topology of gNBs and the O-RUs they drive.
Architecture
The rApp works with four cooperating components.
OCUDU RAN. A monolithic 5G gNB connected to O-RUs over Open Fronthaul 7.2x. It publishes per-cell and per-UE metrics on its remote-control WebSocket, including the fronthaul MAC addresses of each cell when RU metrics are enabled.
OCUDU O1 Adaptor. Reads the gNB metrics stream and translates it into 3GPP TS 28.554 performance-management envelopes. For each unlocked PerfMetricJob it posts an envelope to the job's streamTarget every granularity period.
OCUDU NETCONF. Presents the gNB as a 3GPP network resource model over O1, and holds the PerfMetricJob that points the performance stream at the rApp.
KPI Monitoring rApp. Receives the performance envelopes on POST /pm and stores KPIs in its own InfluxDB. Alert rules are evaluated on every report. KPI and alert information types are published to other rApps through DME, and the rApp's API is registered through SME. O-RUs are reached through SDNR, using RESTCONF to NETCONF, and their performance notifications arrive on SDNR's device notification stream. The rApp is onboarded onto the O-RAN SC Non-RT RIC over R1 and serves an operator dashboard with admin and viewer roles.
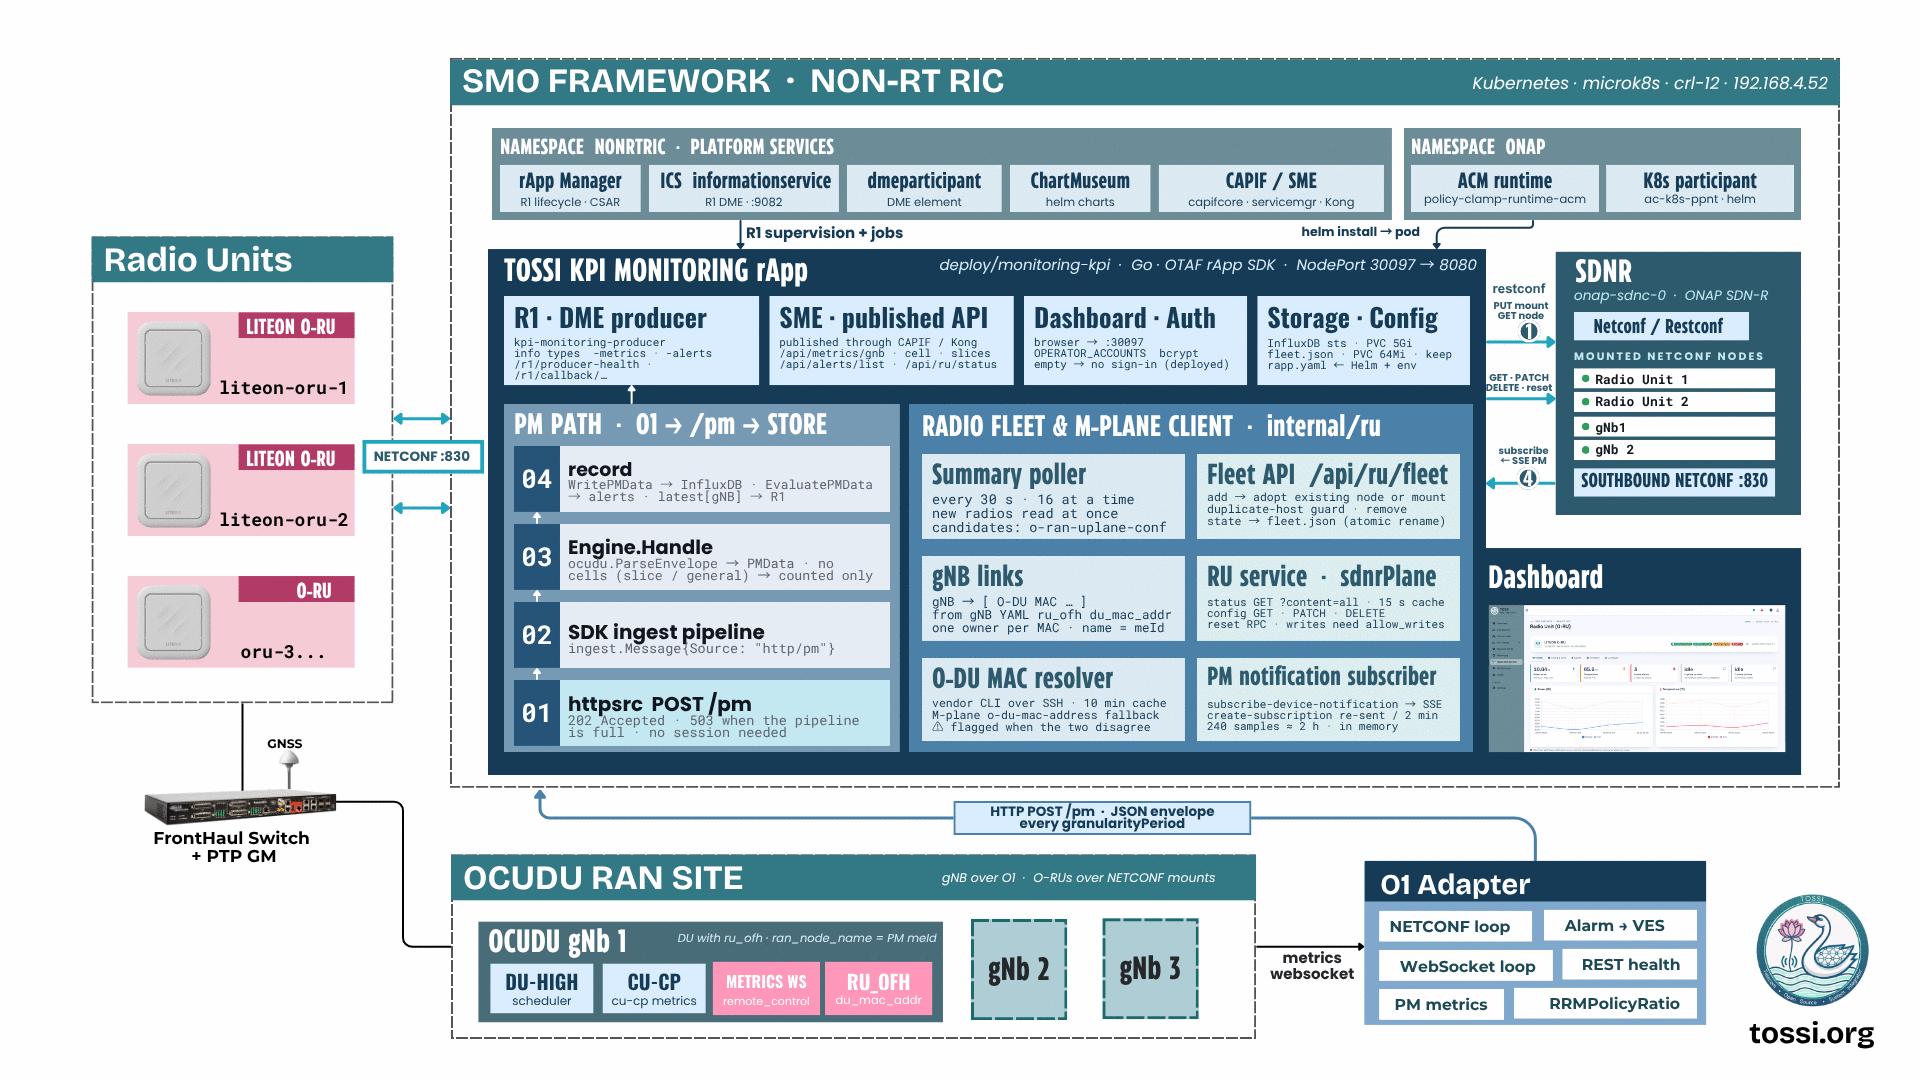
/pm every granularity period; the rApp stores KPIs in InfluxDB, raises alerts, publishes both over R1, and reaches each O-RU through SDNR.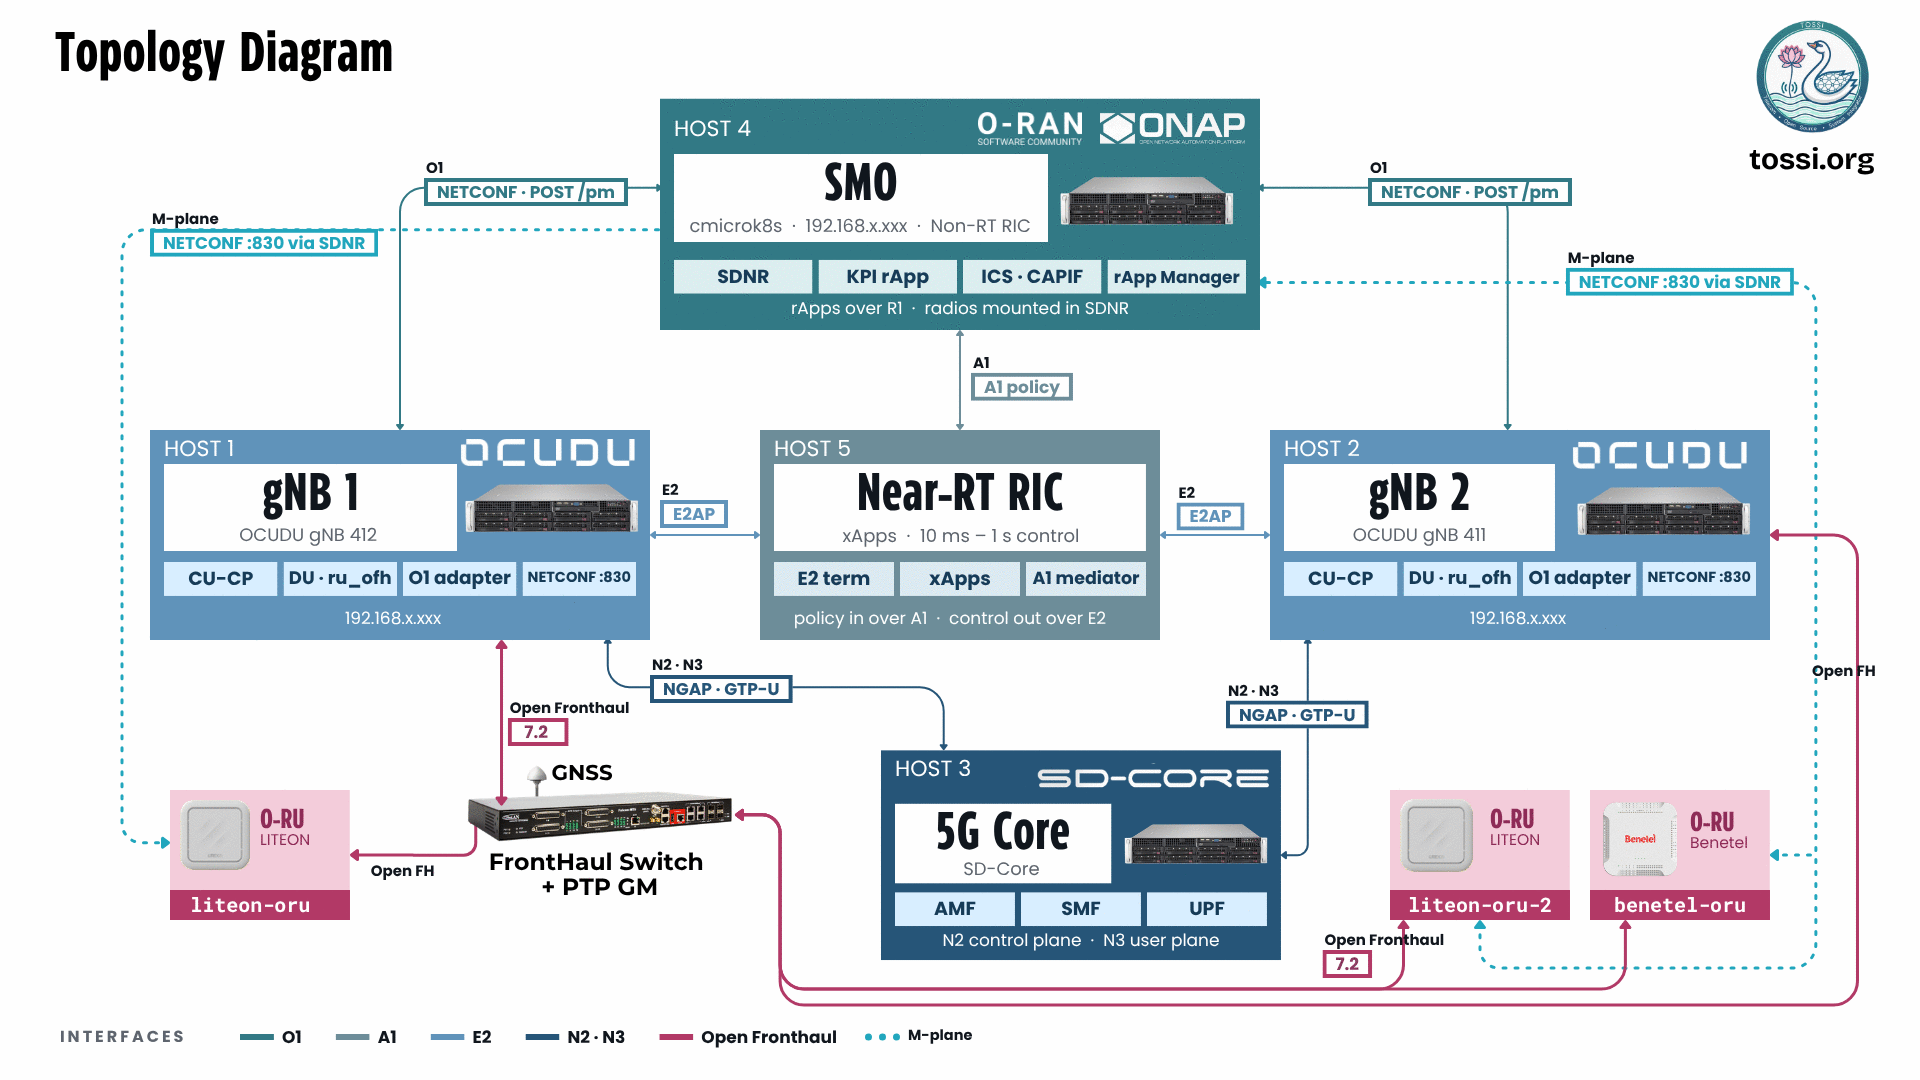
Features
RAN performance monitoring
- Ingests 3GPP TS 28.554 performance envelopes from the OCUDU O1 Adaptor on
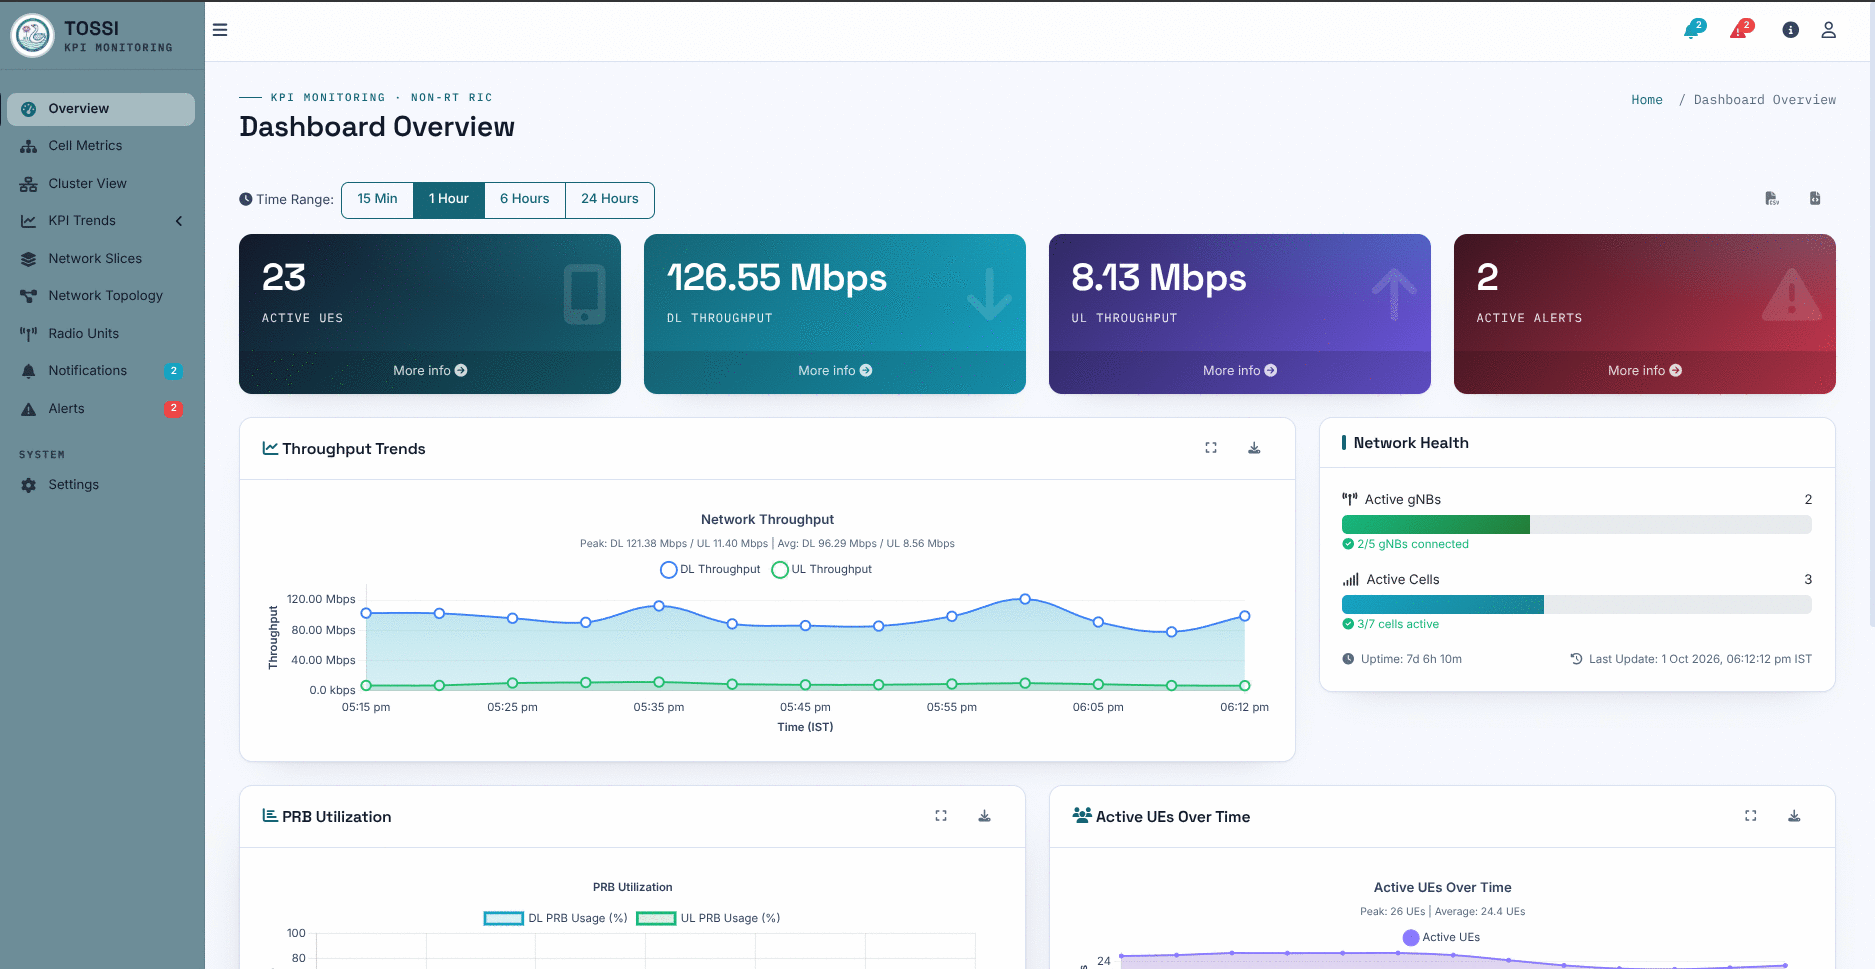
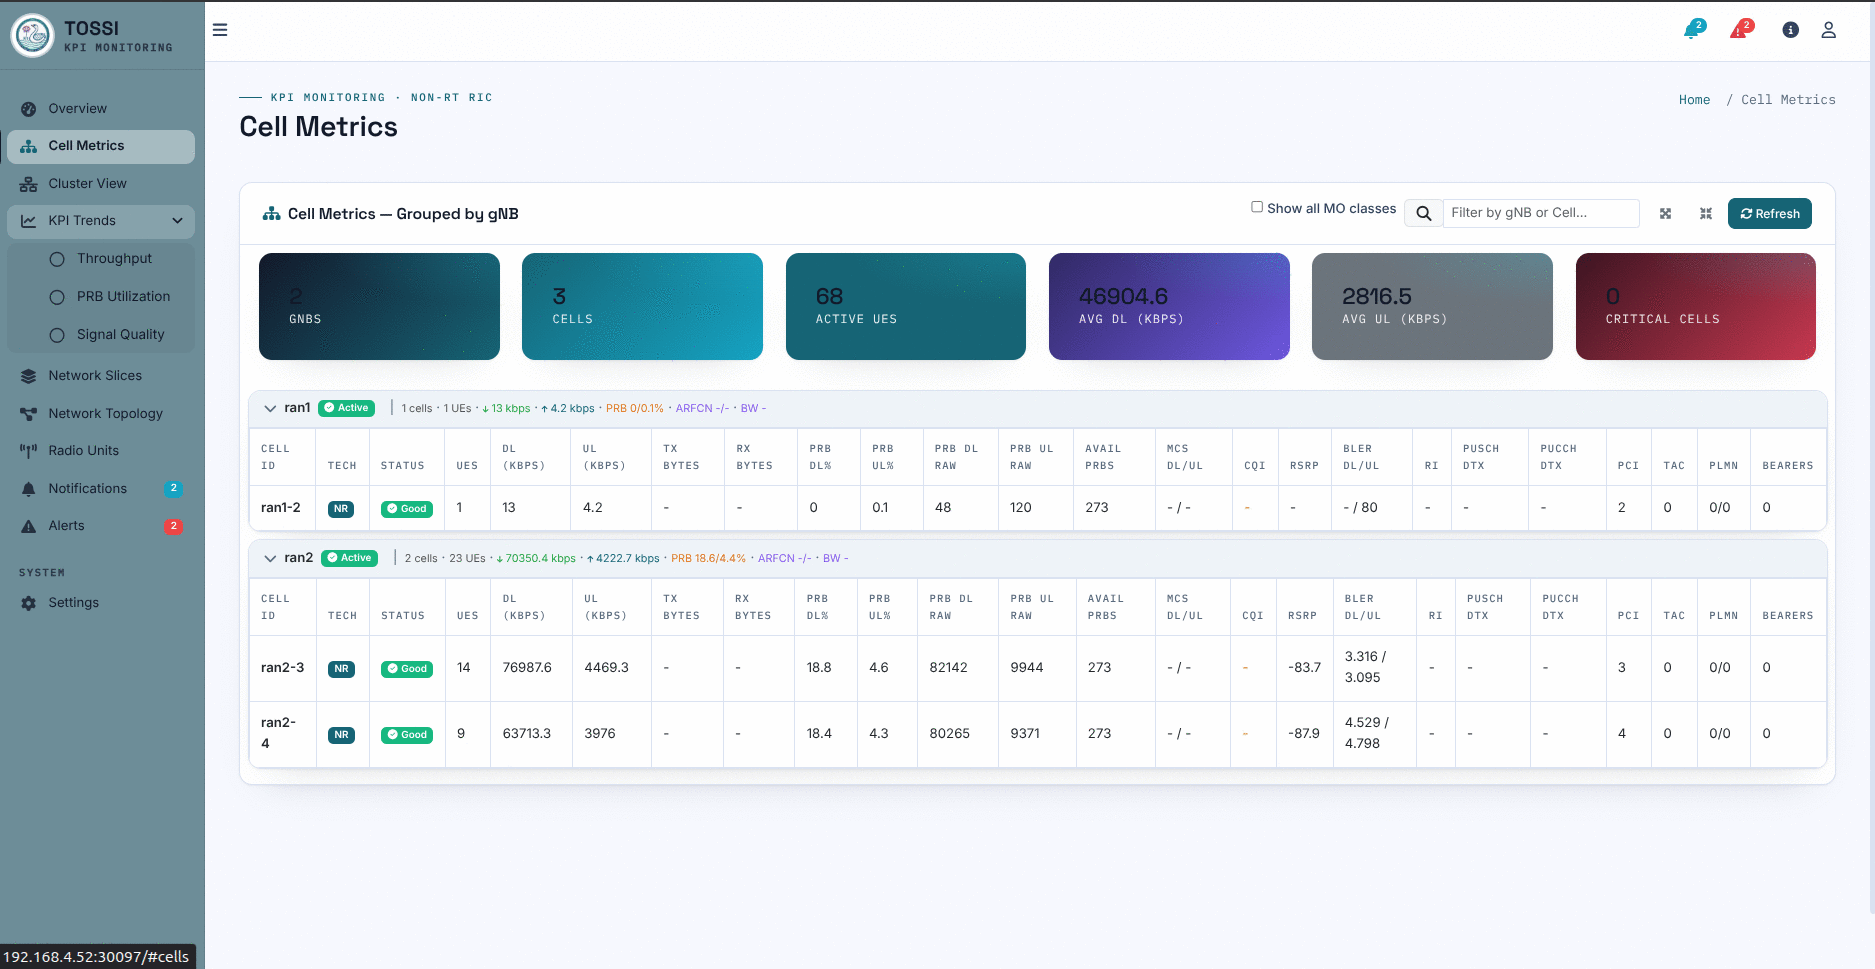
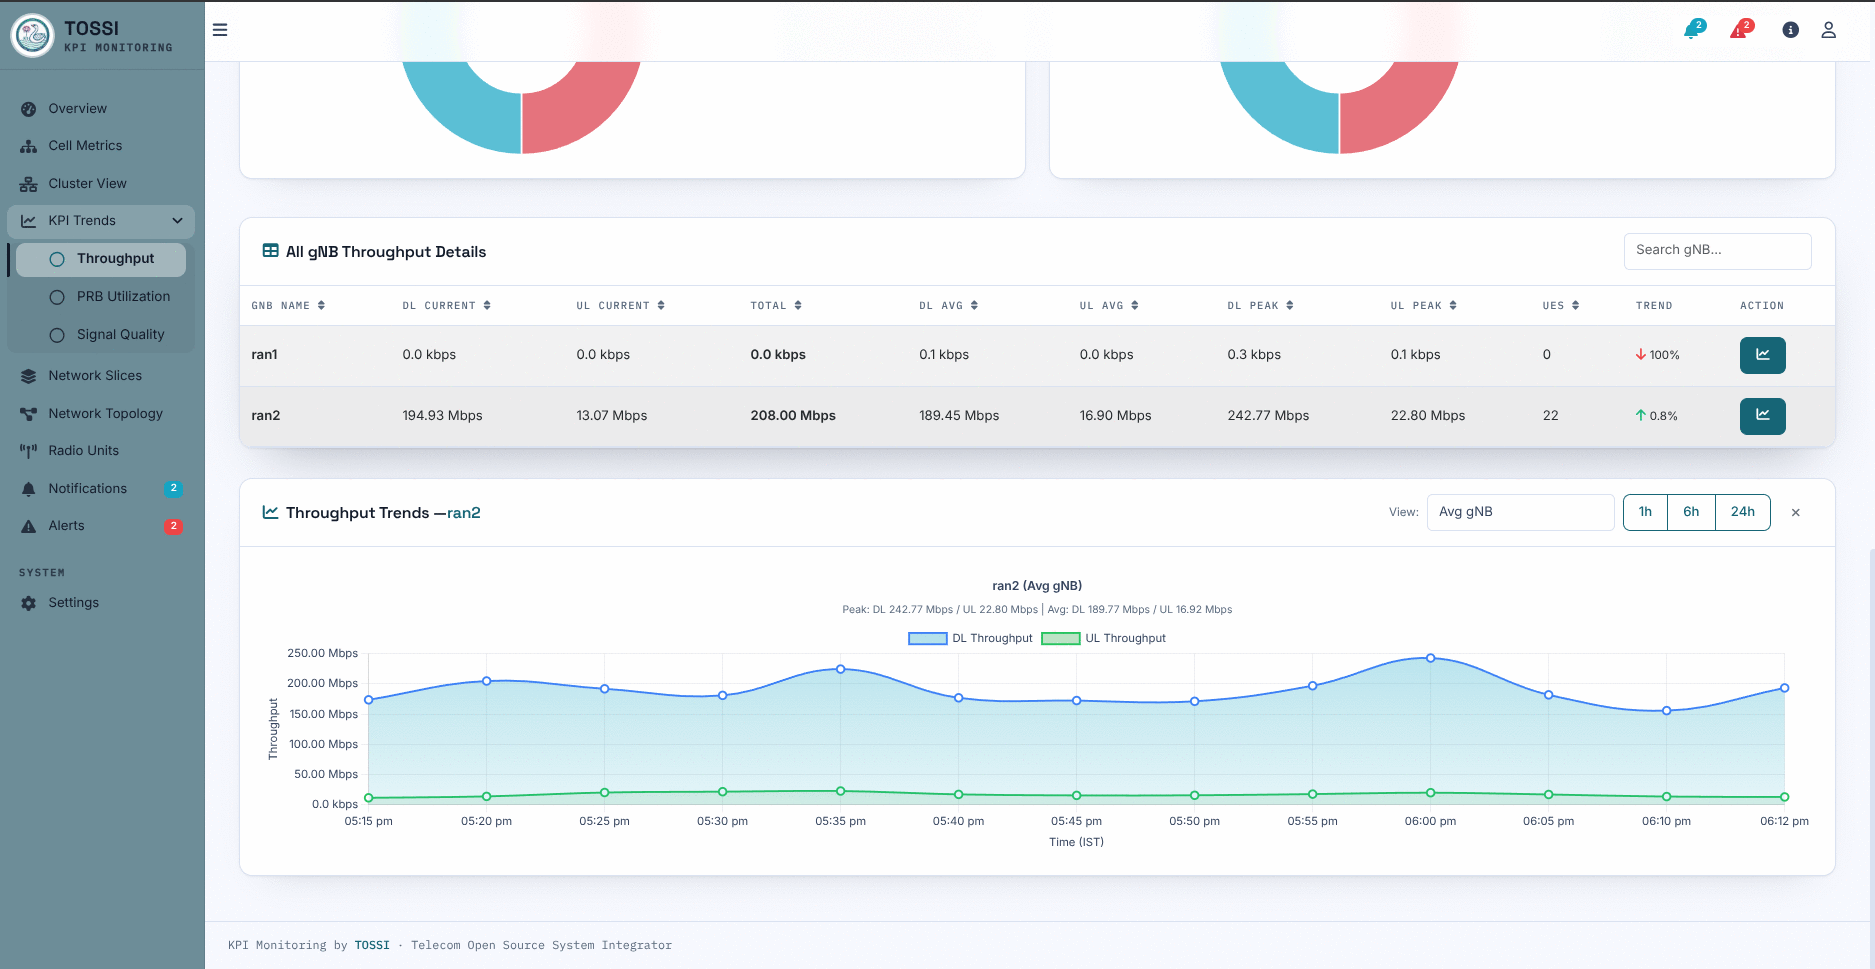
POST /pm, at the granularity period set by the PerfMetricJob. - Cell KPIs: DL and UL throughput, connected UEs, PRB utilisation, DL and UL BLER, and serving RSRP.
- gNB KPIs: totals across each gNB's cells.
- UE KPIs: CQI, MCS, rank and PUSCH SNR.
- KPIs the RAN does not report are shown as missing rather than as zero.
- Time-series history in the rApp's own InfluxDB, with trend charts in the dashboard.
Alerting
- Threshold rules are defined in configuration, so operators can tune them without a rebuild.
- Alerts are deduplicated while a condition persists, and cleared when it recovers.
R1 data exposure
- Publishes two DME information types, KPI reports and active alerts, so other rApps can consume them through ICS.
- Registers its service API with SME (CAPIF) on deployment.
- Onboarded, primed and deployed through rApp Manager as a standard CSAR.
O-RU management over the M-plane
- Reaches O-RUs through SDNR, using RESTCONF to NETCONF, or directly over NETCONF when no SDNR is configured.
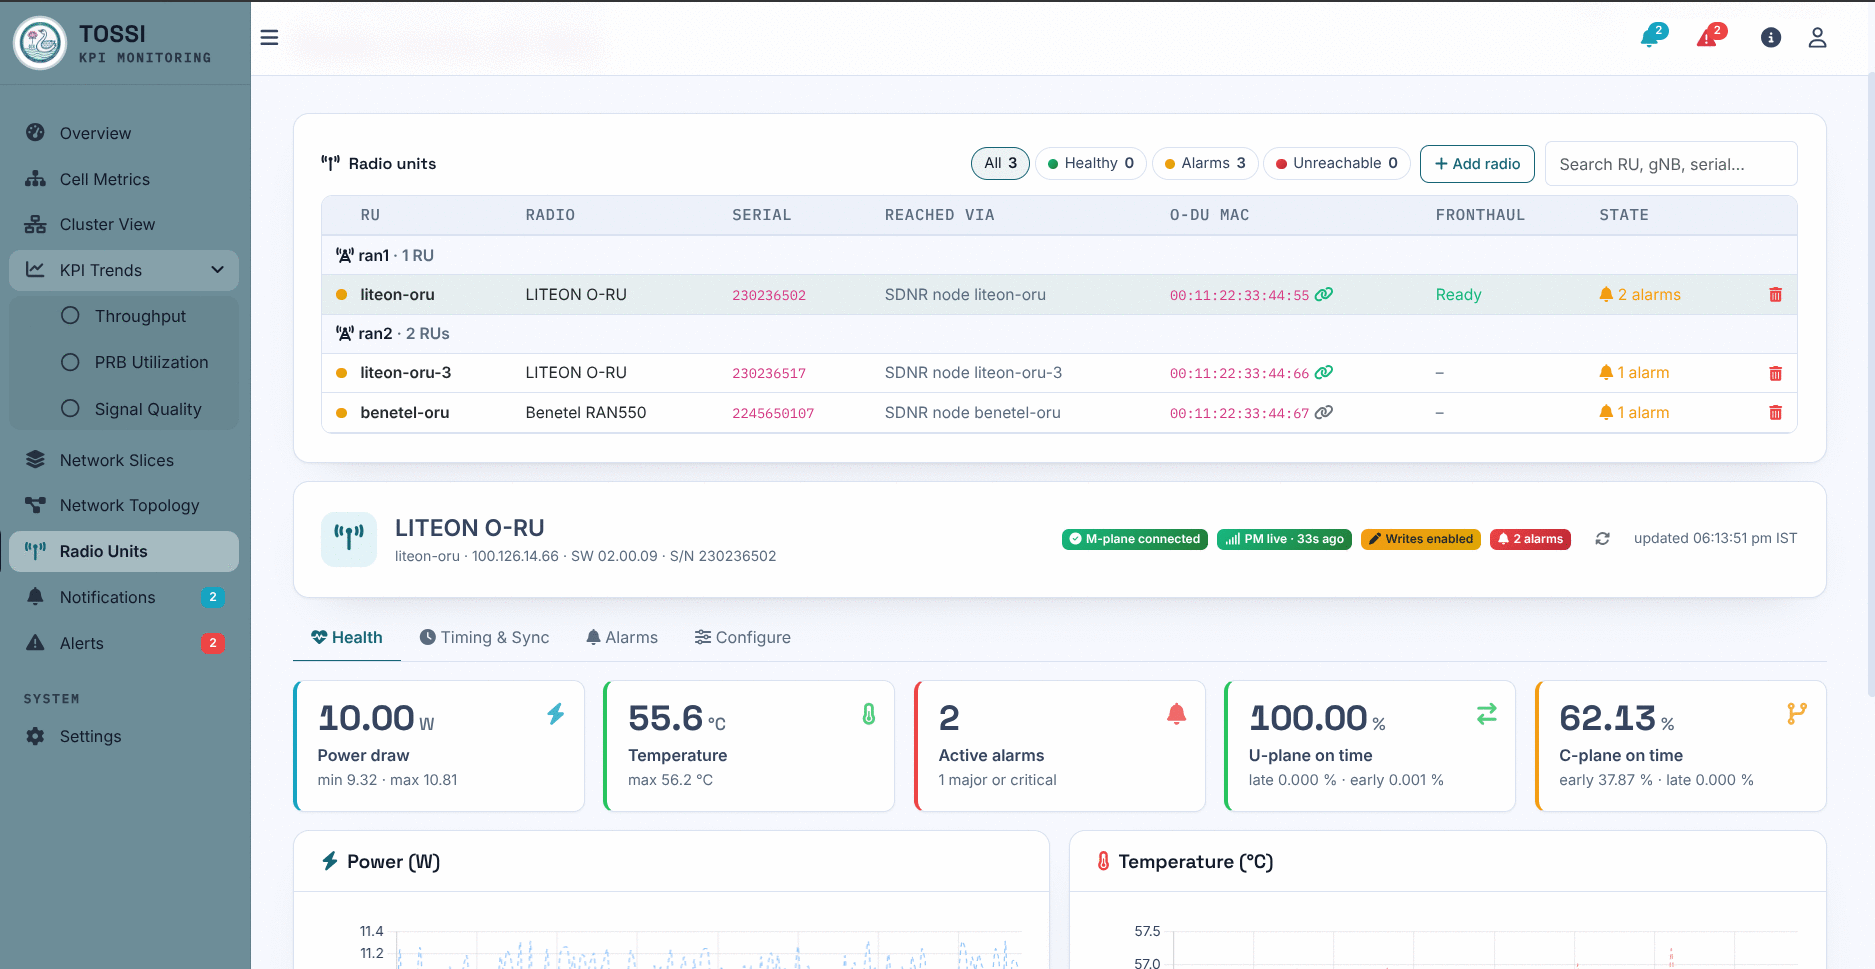
- Per radio: inventory, PTP and sync state, delay profile, FM alarms, and live PM covering power, temperature, transceiver and fronthaul receive-window counters.
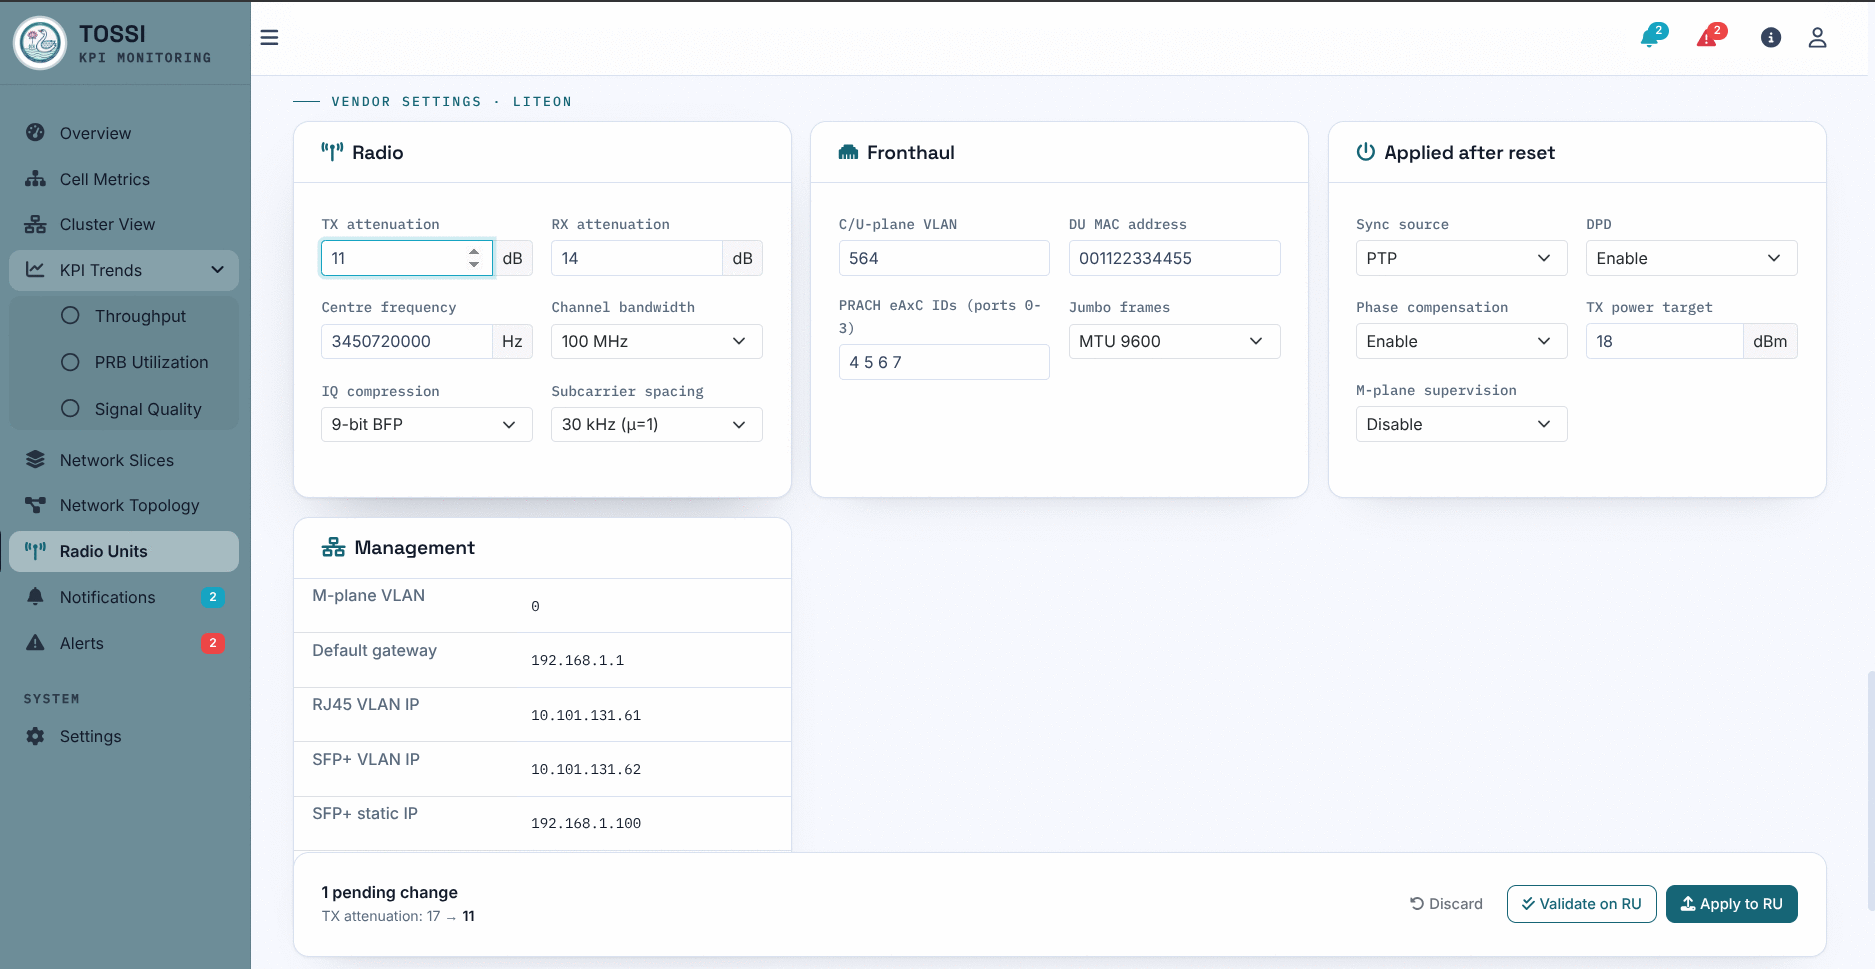
- Edits the standard O-RAN YANG settings a radio advertises in its YANG library, so any O-RAN-compliant O-RU works.
- LITEON vendor settings and fronthaul status over SSH.
- Radio reset through the standard
o-ran-operationsRPC. - Radio PM arrives on SDNR's device notification stream, with automatic recovery when the stream goes quiet.
Discovery and topology
- O-RUs connected in SDNR join the fleet automatically. Others can be added by name and M-plane address from the dashboard.
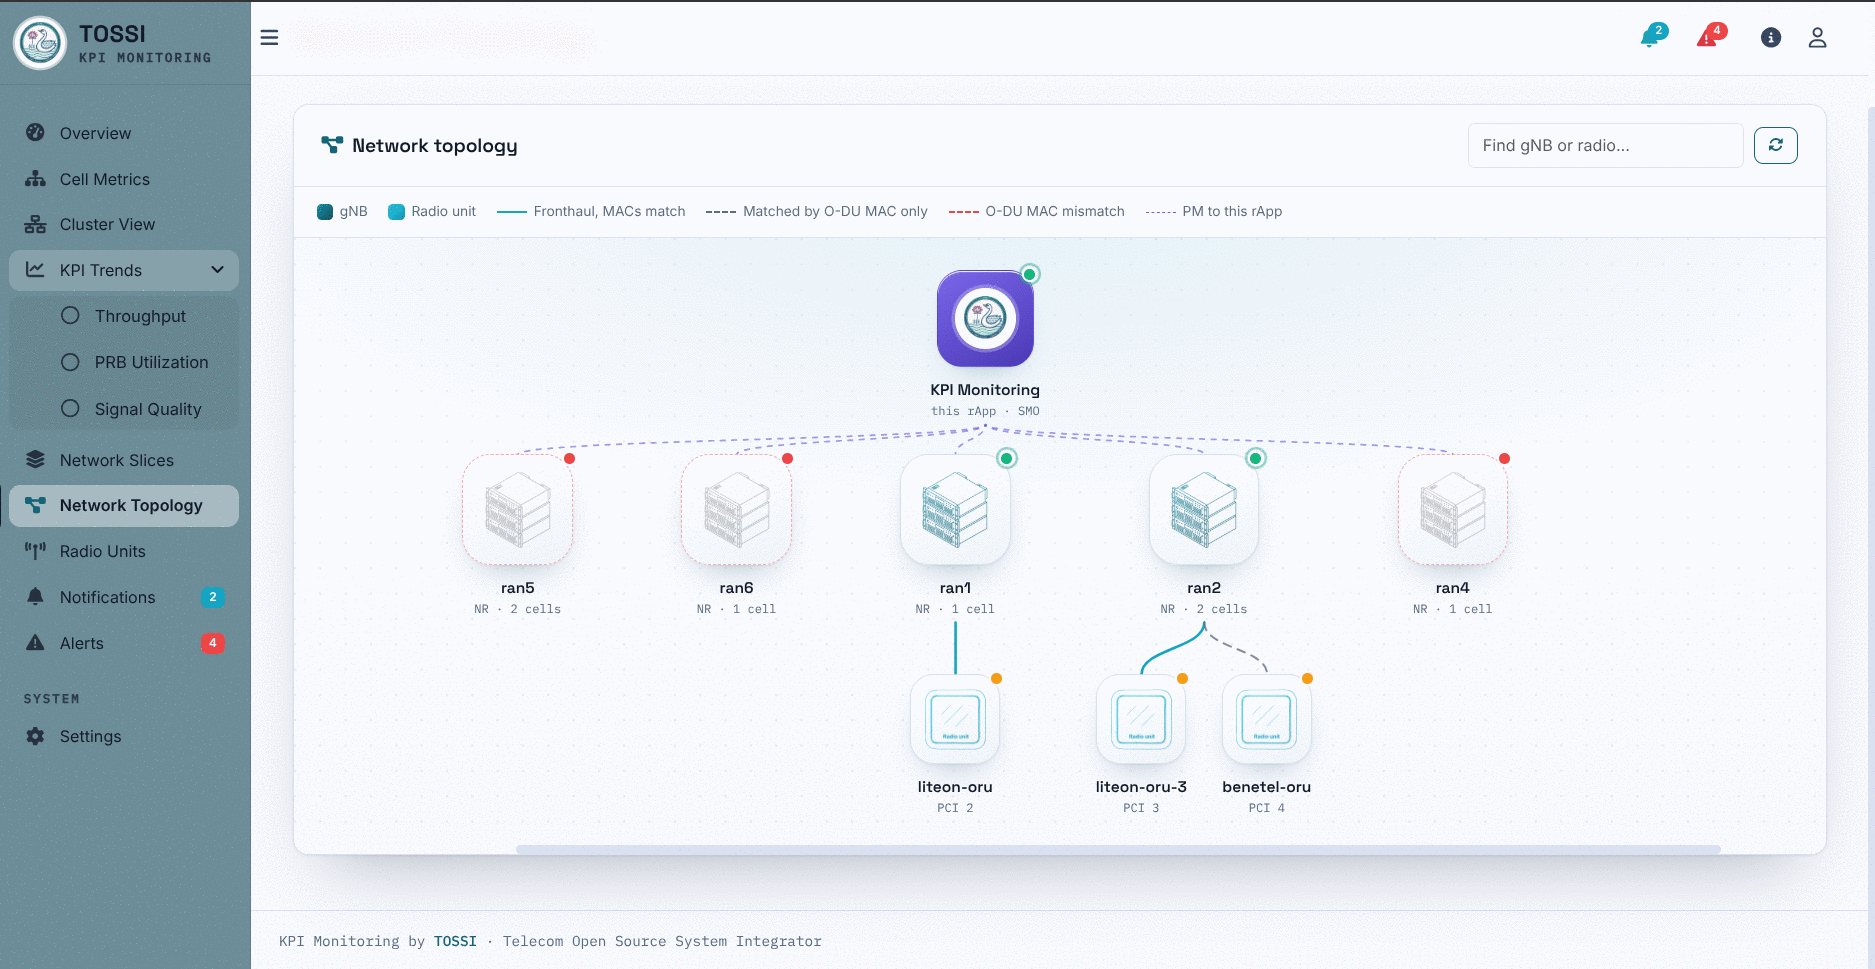
- Each O-RU is linked to the gNB cell that reports its fronthaul MAC address, with the O-DU connection state shown.
- A network topology page shows every gNB and the radios it drives, with key figures on hover and a click-through to each gNB or radio.
- The radio fleet is kept on a persistent volume and survives restarts and redeploys.
Access control
- Operator sign-in for the whole rApp, with bcrypt-hashed accounts.
- Admin and viewer roles: only admins can add, remove or configure radios.
- Radio changes can be disabled entirely with a single setting.
Operations
/health,/ready,/statusand Prometheus/metricsendpoints.- Configuration through a YAML file, with environment variable overrides for secrets. Settings that are still empty are logged at startup.
- Packaged as a Helm chart with its own InfluxDB.
Prerequisites
- A Linux host for the RAN, with a DPDK-capable fronthaul NIC and access to O-RUs.
- Python 3 for the O1 adapter.
- Docker Engine 24.0 or newer, for the NETCONF server and the rApp image.
- An O-RAN SC Non-RT RIC with rApp Manager, ChartMuseum and ICS, and an ONAP SDNR with the O-RUs mounted or reachable. This is the primary deployment target, using R1-based onboarding.
- Go 1.23 or newer, Helm 3 and
rappctlfrom the OTAF rApp SDK, to build the rApp package.
sudo apt install python3 python3-venv python3-pip
go install github.com/coranlabs/OTAF/otaf-rapp-sdk/cmd/rappctl@latest
Deployment
Clone the TOSSI components into a working directory:
git clone -b xnap_handover https://github.com/TOSSI-Foundation/OCUDU-RAN.git
git clone -b main https://github.com/TOSSI-Foundation/OCUDU-Netconf.git
git clone -b main https://github.com/TOSSI-Foundation/OCUDU-O1-Adaptor.git
git clone -b main https://github.com/TOSSI-Foundation/kpi-monitoring-rapp.git
NETCONF server (start first)
cd OCUDU-Netconf
docker build -t ocudu-netconf/ocudu-netconf:latest .
docker run -it --name ocudu-netconf -p 830:830 ocudu-netconf/ocudu-netconf:latest --config gnb
cd ..
The server is ready when it logs that it is listening for connections on port 830.
RAN (gNB)
Build the gNB, installing the build dependencies listed in the OCUDU-RAN README first, including DPDK:
cd OCUDU-RAN
mkdir -p build && cd build
sudo cmake -DDU_SPLIT_TYPE=SPLIT_7_2 -DENABLE_DPDK=True -DASSERT_LEVEL=MINIMAL -DENABLE_UHD=OFF ../
make -j "$(nproc)"
cd ../..
Edit a LITEON example configuration under OCUDU-RAN/configs/ for your site, covering the core and AMF address, the fronthaul NIC, the O-RU parameters and the CPU affinities. Enable JSON metrics and the RU metrics layer, which carries the fronthaul MAC addresses the rApp uses to link each O-RU to its gNB:
remote_control:
  enabled: true
  bind_addr: 0.0.0.0
  port: 8001

metrics:
  enable_json: true
  layers:
    enable_ru: true
If the gNB does not report fronthaul MACs, the rApp still monitors its KPIs and its O-RUs, but lists the O-RUs under no gNB.
Then run the gNB:
sudo ./OCUDU-RAN/build/apps/gnb/gnb -c OCUDU-RAN/configs/<your-gnb-config>.yml
O1 adapter
cd OCUDU-O1-Adaptor
python3 -m venv venv
./venv/bin/pip install -r requirements.txt
./venv/bin/python src/o1_adapter.py \
  --netconf_host localhost --netconf_port 830 \
  --netconf_username root --netconf_password root \
  --profile gnb --ws_host localhost --ws_port 8001
cd ..
KPI Monitoring rApp
Primary path: R1-based deployment through the O-RAN SC Non-RT RIC rApp Manager.
The ACM Kubernetes participant installs the chart from ChartMuseum and ignores instance values, so site configuration and secrets have to be built into the package. scripts/package.py writes them into a git-ignored copy of the chart and runs rappctl package.
Create the operator accounts. Each entry is name:bcrypt-hash, and rappctl hashpw prints the hash for a password:
rappctl hashpw # once per account
Build the image and push it to the SMO's local registry, which the chart pulls from by default at localhost:5000. To use another registry, set global.registry.url in deploy/helm/kpi-monitoring-rapp/values.yaml before packaging:
cd kpi-monitoring-rapp
docker build -t localhost:5000/kpi-monitoring-rapp:1.0.0 .
docker push localhost:5000/kpi-monitoring-rapp:1.0.0
Build the CSAR with your site's values:
SDNR_PASSWORD=<sdnr-admin-password> \
FLEET_KEY_ID=<sdnr-keystore-key> \
RU_KEY_FILE=<ssh-key-for-o-rus> \
RU_ALLOW_WRITES=true \
OPERATOR_ACCOUNTS='admin:<hash>,viewer:<hash>' \
ADMIN_ACCOUNTS=admin \
NODE_PORT=30096 \
python3 scripts/package.py
rappctl validate dist/kpi-monitoring-rapp-1.0.0.csar
| Variable | Purpose |
|---|---|
SDNR_PASSWORD, SDNR_ADDR | Reach O-RUs through SDNR. SDNR_ADDR defaults to http://sdnc.onap.svc.cluster.local:8282 |
FLEET_KEY_ID | SDNR keystore key used when the rApp mounts a new O-RU |
RU_KEY_FILE | SSH key for O-RUs reached directly, and for LITEON vendor settings |
RU_ALLOW_WRITES | Allow adding, removing and configuring O-RUs from the dashboard |
OPERATOR_ACCOUNTS | Dashboard accounts. With any set, the whole rApp requires sign-in |
ADMIN_ACCOUNTS | Accounts allowed to change O-RUs. The others can only view |
NODE_PORT | Dashboard NodePort |
Upload the chart, then onboard, prime, create an instance and deploy:
RM=$(kubectl get svc rappmanager -n nonrtric -o jsonpath='{.spec.clusterIP}')
CM=$(kubectl get svc chartmuseum -n nonrtric -o jsonpath='{.spec.clusterIP}')

# upload the chart
unzip -o -j dist/kpi-monitoring-rapp-1.0.0.csar \
  Artifacts/Deployment/HELM/kpi-monitoring-rapp-1.0.0.tgz -d dist/
curl --data-binary @dist/kpi-monitoring-rapp-1.0.0.tgz http://$CM:8080/api/charts

# onboard
curl -X POST http://$RM:8080/rapps/kpi-monitoring-rapp \
  -F file=@dist/kpi-monitoring-rapp-1.0.0.csar

# prime
curl -X PUT http://$RM:8080/rapps/kpi-monitoring-rapp \
  -H 'Content-Type: application/json' -d '{"primeOrder":"PRIME"}'

# create instance (ACM + SME + DME), capture the instance id
IID=$(curl -s -X POST http://$RM:8080/rapps/kpi-monitoring-rapp/instance \
  -H 'Content-Type: application/json' \
  -d @dist/kpi-monitoring-rapp-instance-body.json \
  | python3 -c 'import json,sys;print(json.load(sys.stdin)["rappInstanceId"])')
echo "instance: $IID"

# deploy
curl -X PUT http://$RM:8080/rapps/kpi-monitoring-rapp/instance/$IID \
  -H 'Content-Type: application/json' -d '{"deployOrder":"DEPLOY"}'
The instance body creates the ACM instance kpimonitoringrapp-instance, the SME provider and API kpi-monitoring-rapp-provider and kpi-monitoring-rapp-api, and the DME producer kpi-monitoring-rapp-producer with the information types kpi-monitoring-rapp-metrics and kpi-monitoring-rapp-alerts.
When the instance reports DEPLOYED, open the dashboard at http://<node-ip>:30096 and sign in.
The example configuration ships two accounts, one per role:
| Username | Password | Role |
|---|---|---|
admin | g_Ski2att3kWHGXa | Full access, including adding, removing and configuring radios |
viewer | ANrhsROhVS7yjqKl | Read-only |
Optional: manual Helm deployment, standalone and without R1.
docker build -t <registry>/kpi-monitoring-rapp:1.0.0 .
docker push <registry>/kpi-monitoring-rapp:1.0.0
helm install kpi-monitoring-rapp deploy/helm/kpi-monitoring-rapp -n <namespace> \
  --set global.registry.url=<registry> --set image.tag=1.0.0 \
  --set ru.sdnr.endpoint=<sdnr-restconf-url> \
  --set secrets.sdnrPassword=<password> \
  --set ru.allowWrites=true --set fleet.mountKeyId=<sdnr-keystore-key> \
  --set secrets.operatorAccounts='admin:<hash>' --set adminAccounts=admin \
  --set secrets.influxdbAdminPassword=<password> \
  --set secrets.influxdbAdminToken=<token> --set secrets.influxdbToken=<token>
The chart deploys the rApp's own InfluxDB alongside it.
Provision O1 performance streaming
The NETCONF server re-seeds its factory config on every start, so run this once after it comes up, and again after any restart, to point the gNB's O1 performance stream at the rApp. It is an idempotent merge and is safe to re-run.
STREAM_TARGET="http://<node-ip>:30096/pm" ./OCUDU-O1-Adaptor/venv/bin/python - <<'PY'
import os
from ncclient import manager
t = os.environ["STREAM_TARGET"]
cfg = f"""<config xmlns="urn:ietf:params:xml:ns:netconf:base:1.0"><ManagedElement xmlns="urn:3gpp:sa5:_3gpp-common-managed-element"><id>ran1</id><GNBCUCPFunction xmlns="urn:3gpp:sa5:_3gpp-nr-nrm-gnbcucpfunction"><id>cucp1</id><PerfMetricJob><id>kpi-monitoring-rapp</id><attributes><administrativeState>UNLOCKED</administrativeState><performanceMetrics>DRB.MaxActiveUeDl</performanceMetrics><granularityPeriod>5</granularityPeriod><streamTarget>{t}</streamTarget></attributes></PerfMetricJob></GNBCUCPFunction></ManagedElement></config>"""
with manager.connect(host="localhost", port=830, username="root", password="root", hostkey_verify=False, allow_agent=False, look_for_keys=False, timeout=20) as m:
    m.edit_config(target="running", config=cfg, default_operation="merge")
    print("PerfMetricJob:", "PROVISIONED" if "kpi-monitoring-rapp" in m.get_config(source="running").data_xml else "FAILED")
PY
Prints PerfMetricJob: PROVISIONED on success. The adapter picks up the job over its NETCONF subscription, so no restart is required. Inside the cluster, the target can be http://kpi-monitoring-rapp.<namespace>.svc.cluster.local:8080/pm.
Verify
- The gNB appears in the dashboard's cell and gNB views within one granularity period.
- O-RUs connected in SDNR appear under Radio Units and on the Network Topology page, grouped under the gNB that drives them.
GET /healthon the rApp returns 200.
References
- OCUDU RAN: TOSSI-Foundation/OCUDU-RAN
- OCUDU NETCONF: TOSSI-Foundation/OCUDU-Netconf
- OCUDU O1 Adaptor: TOSSI-Foundation/OCUDU-O1-Adaptor
- KPI Monitoring rApp: TOSSI-Foundation/kpi-monitoring-rapp
- OTAF rApp SDK: coranlabs/OTAF
- Cell Congestion Optimization rApp: TOSSI documentation