Skip to content

Open AI-RAN Testbed

The Open AI-RAN Testbed is a platform for deploying, simulating and training open-source 5G RAN configurations. It provides one automation engine, one dashboard and one command-line interface over a catalogue of RAN stacks, from a software-simulated radio through to an over-the-air deployment with real radio units.

The same engine drives three entry points. An engineer runs make <verb> STACK=<name> from a shell, an operator uses the dashboard in a browser, and an LLM agent calls the same actions under an approval gate. All three execute identical targets and share one settings file per stack, so a configuration changed in one place is the configuration the others use.
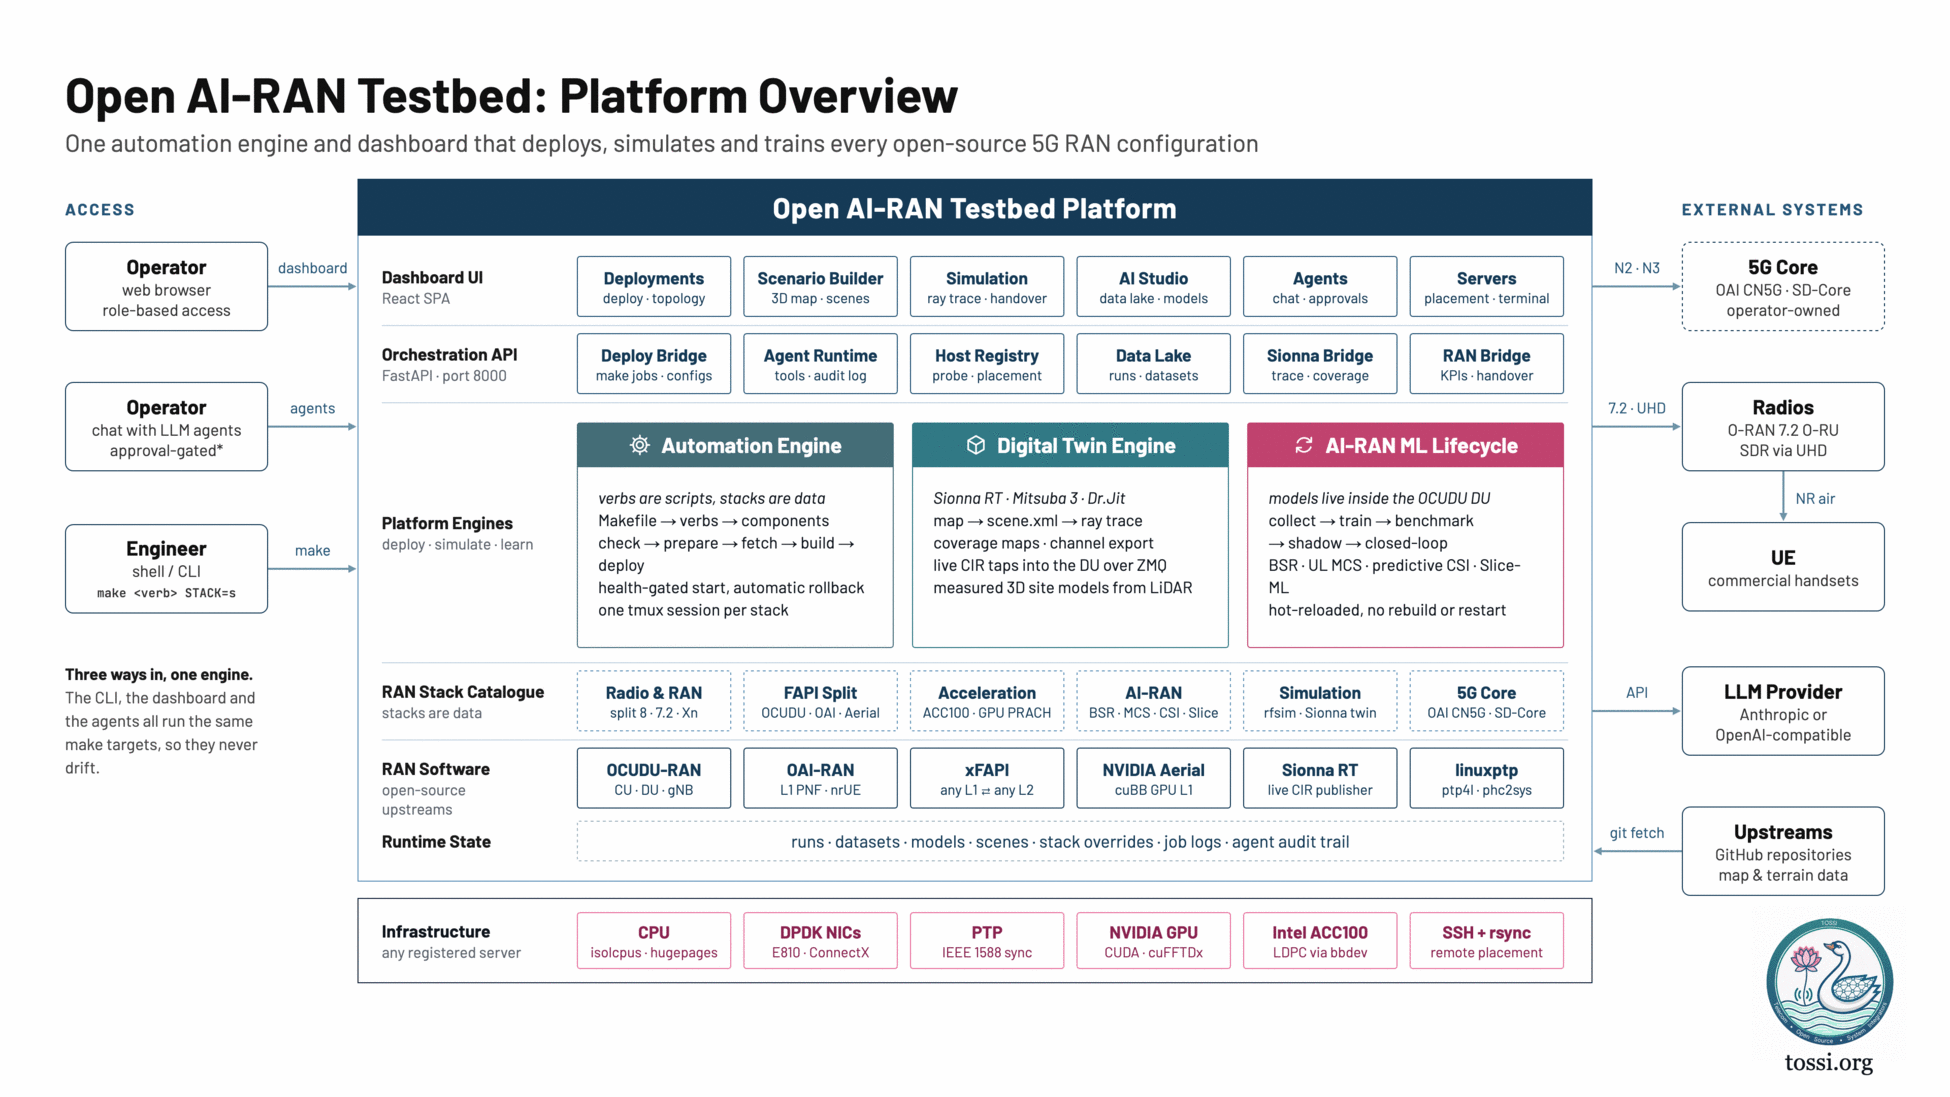
Platform overview of the Open AI-RAN Testbed, described as one automation engine and dashboard that deploys, simulates and trains every open-source 5G RAN configuration. On the left, an access column shows three ways in: an operator using a web browser with role-based access reaching the dashboard; an operator chatting with LLM agents under an approval gate; and an engineer using the shell or CLI with make verb STACK commands. A note reads that the CLI, the dashboard and the agents all run the same make targets, so they never drift. The centre holds the platform itself in six rows. The Dashboard UI, a React single-page application, offers Deployments for deploy and topology, Scenario Builder for the 3D map and scenes, Simulation for ray trace and handover, AI Studio for the data lake and models, Agents for chat and approvals, and Servers for placement and a terminal. The Orchestration API, FastAPI on port 8000, offers a Deploy Bridge for make jobs and configs, an Agent Runtime for tools and an audit log, a Host Registry for probing and placement, a Data Lake for runs and datasets, a Sionna Bridge for trace and coverage, and a RAN Bridge for KPIs and handover. Platform Engines holds three blocks: an Automation Engine where verbs are scripts and stacks are data, running check, prepare, fetch, build and deploy with health-gated start, automatic rollback and one tmux session per stack; a Digital Twin Engine using Sionna RT with Mitsuba 3 and Dr.Jit, taking a map to a scene.xml to a ray trace, producing coverage maps and channel export, with live channel impulse response taps into the DU over ZMQ and measured 3D site models from LiDAR; and an AI-RAN ML Lifecycle where models live inside the OCUDU DU, running collect, train, benchmark, shadow and closed-loop over BSR, UL MCS, predictive CSI and Slice-ML, hot-reloaded with no rebuild or restart. A RAN Stack Catalogue row lists families of stacks as data: Radio and RAN covering split 8, 7.2 and Xn; FAPI Split covering OCUDU, OAI and Aerial; Acceleration covering ACC100 and GPU PRACH; AI-RAN covering BSR, MCS, CSI and Slice; Simulation covering rfsim and the Sionna twin; and 5G Core covering OAI CN5G and SD-Core. A RAN Software row lists the open-source upstreams: OCUDU-RAN providing CU, DU and gNB; OAI-RAN providing L1 PNF and nrUE; xFAPI bridging any L1 to any L2; NVIDIA Aerial providing a cuBB GPU L1; Sionna RT as a live channel impulse response publisher; and linuxptp providing ptp4l and phc2sys. A Runtime State row covers runs, datasets, models, scenes, stack overrides, job logs and the agent audit trail. On the right, external systems show a 5G core that is operator-owned, radios using O-RAN 7.2 O-RU and SDR via UHD reaching a UE over the NR air interface, an LLM provider that is Anthropic or OpenAI-compatible, and upstream GitHub repositories with map and terrain data. An infrastructure band at the bottom lists what any registered server may provide: CPU with isolcpus and hugepages, DPDK NICs such as E810 and ConnectX, PTP with IEEE 1588 sync, an NVIDIA GPU with CUDA and cuFFTDx, an Intel ACC100 providing LDPC via bbdev, and SSH with rsync for remote placement.
Figure 1: The platform in one view. The dashboard, the CLI and the agents all drive the same automation engine, which deploys stacks from a catalogue onto any registered server.

Features

One engine, three interfaces

Verbs are scripts and stacks are data. A stack is a configuration file listing its components, their start order, the capabilities it requires and the variables its components read. Every component implements the same contract: deps, build, configure, start, stop and status.

Per-stack settings are written to one overrides file that both the dashboard and the command line read, so the two cannot disagree. Settings resolve in a fixed order: a value passed on the make command line, then the stack's overrides file, then the stack configuration, then the pinned versions file.
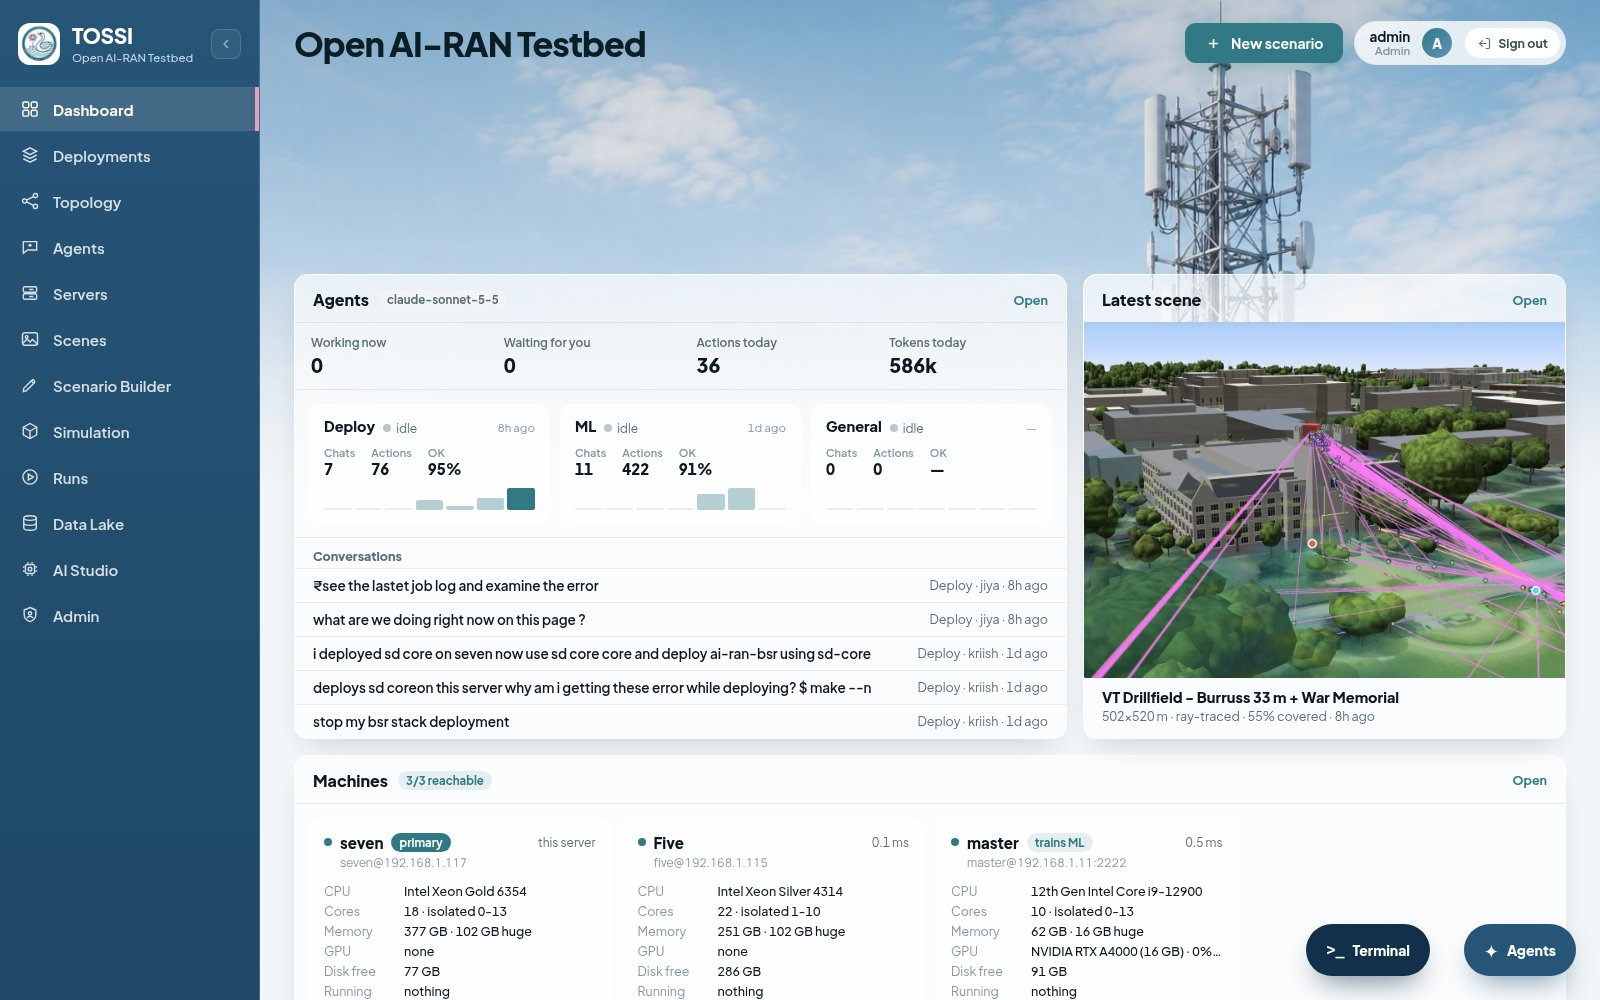
The dashboard home page of the Open AI-RAN Testbed. A left navigation rail lists Dashboard, Deployments, Topology, Agents, Servers, Scenes, Scenario Builder, Simulation, Runs, Data Lake, AI Studio and Admin. An Agents card shows three agents, Deploy, ML and General, each with its chat count, actions today and an OK percentage, above a list of recent conversations. A Latest scene card shows a ray-traced 3D view of a campus scene with its area, coverage percentage and age. A Machines card lists three registered servers with their CPU model, core count and isolated cores, memory and hugepages, GPU, free disk and what is currently running, with one marked primary and one marked as the server that trains ML. A terminal and an agents control sit at the bottom right.
Figure 2: The home page. Agent activity, the most recent scene, and the registered servers with their capabilities and current load.

Stack catalogue

Stacks are grouped by family. Each is deployed, stopped and configured the same way.

FamilyStacks
5G Corecore-oai-cn5g, core-sd-core
Radio and RANocudu-split72-liteon, ocudu-split8-usrp, ocudu-split8-zmq, ocudu-xnap-handover
FAPI splitaerial-l1-xfapi-ocudu-l2, oai-l1-xfapi-ocudu-l2, ocudu-l1-xfapi-ocudu-l2
Hardware accelerationocudu-gpu-inline, ocudu-hwacc-acc100, ocudu-prach-gpu
Simulationmulti-ue-sim, rfsim-multi-ue, sionna-rt-ocudu
AI-RANai-ran-bsr, ai-ran-csi, ai-ran-mcs, ai-ran-slice
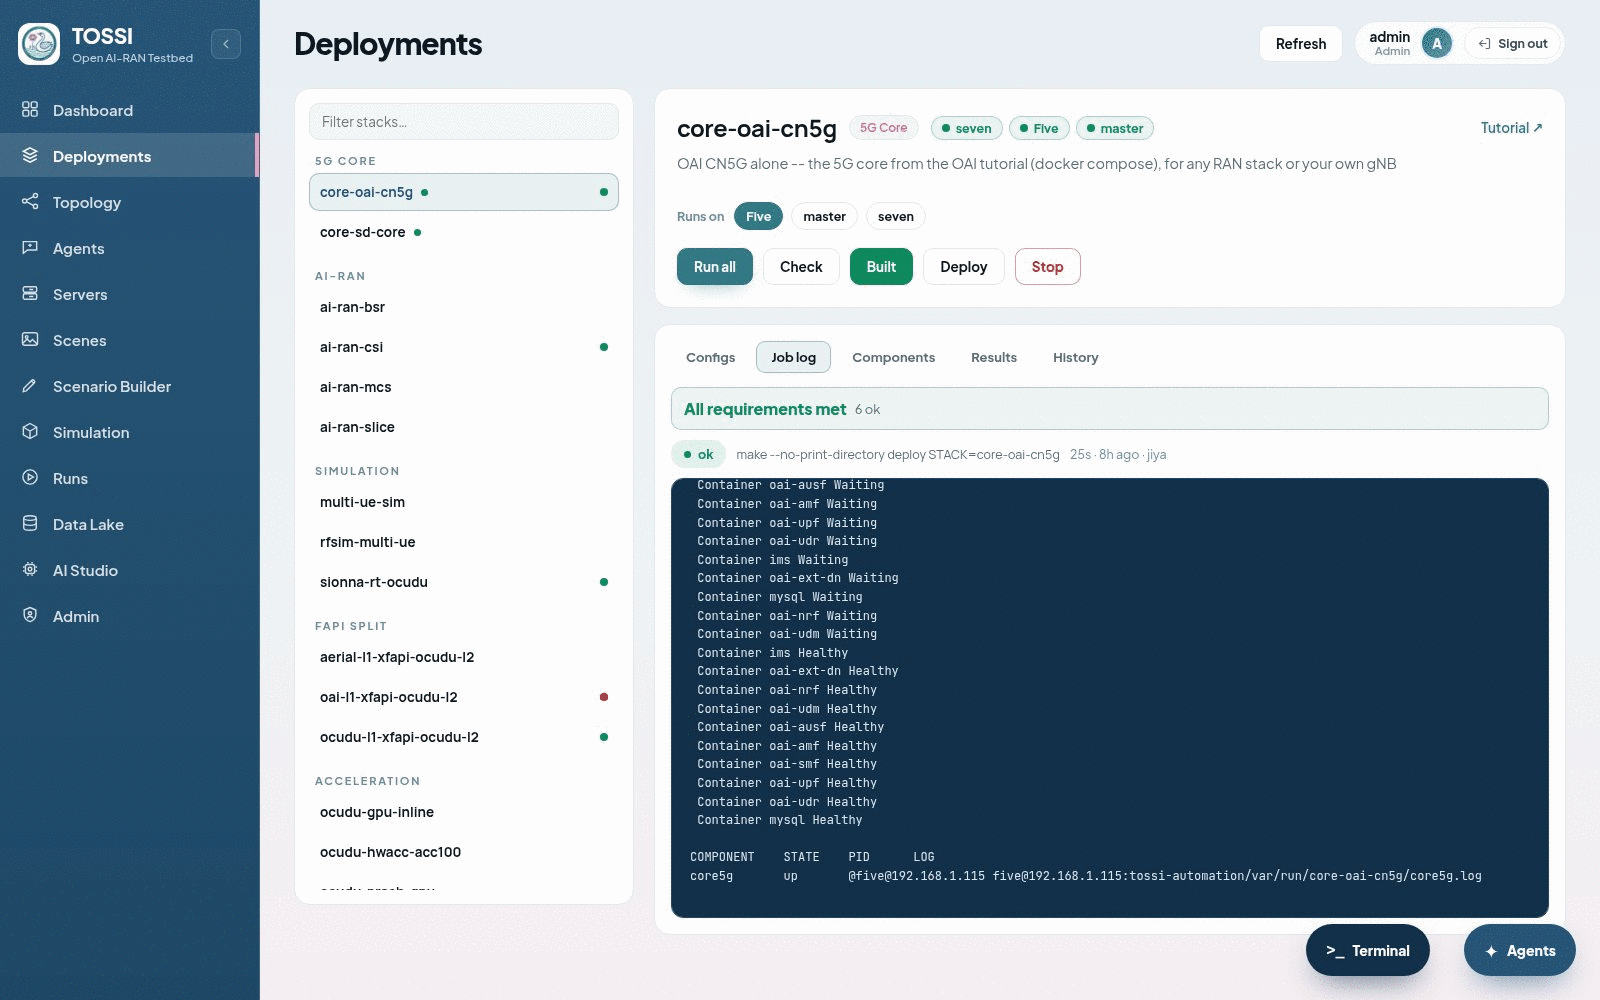
The Deployments page with a job log open. A left column lists the stacks grouped by family, 5G Core, AI-RAN, Simulation, FAPI split and Acceleration, each entry carrying a status dot. The selected stack is a 5G core stack, with its description, a tutorial link, a row of server chips under Runs on, and the action buttons Run all, Check, Built, Deploy and Stop. Tabs below offer Configs, Job log, Components, Results and History. The job log reports all requirements met, shows the exact make command that was run with its duration and user, and streams the container start-up lines as each network function moves from Waiting to Healthy. A component table at the bottom gives the component name, its state as up, the process id and the path of its log.
Figure 3: A deployment in progress. The job log carries the exact command that was run, the live output, and the per-component state.

Server placement

Any number of servers can be registered. One is the primary and orchestrates the rest over SSH. Each server is probed for its capabilities, which include isolated CPU cores, hugepages, a DPDK-capable NIC, PTP, a hardware accelerator and a GPU.

When a stack is selected, the registered servers are ranked against the capabilities it requires, and a server that cannot satisfy them is shown as unavailable with the unmet requirement given. A whole stack can be moved to one server, or individual components placed on different servers. Before each action the primary copies the automation tree and the stack settings to the remote server and runs the component there.
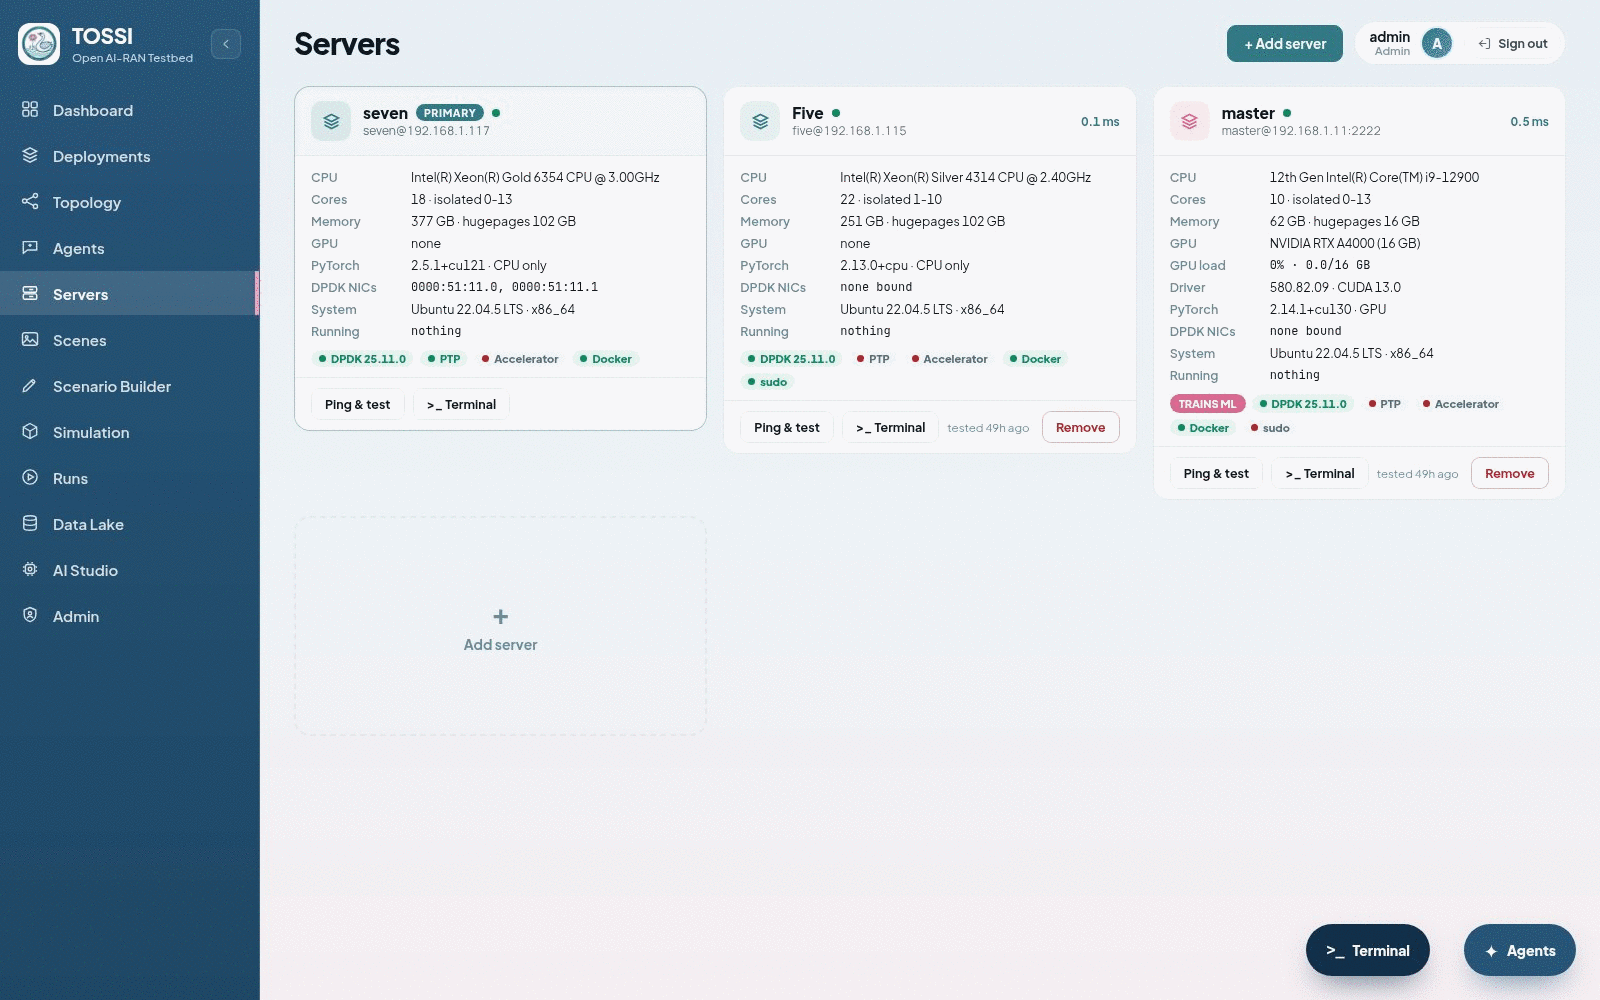
The Servers page. Each registered server is shown as a card giving its nickname and address, CPU model, core count with isolated cores, memory with hugepages, GPU and PyTorch build, DPDK-capable network interfaces, operating system and what is currently running on it. Capability badges on each card record whether the server provides DPDK, PTP, a hardware accelerator, a container runtime and passwordless privilege escalation, with one server additionally badged as the one that trains ML. Controls allow a server to be added, re-probed or removed.
Figure 4: Registered servers with their probed capabilities. A stack is ranked against these before it can be placed on a server.

Digital twin

The Scenario Builder draws an area on a map, places transmitters, receivers and a route for a moving receiver, and builds a 3D scene. Building can use open map data with optional terrain and foliage, or a measured site model with surveyed footprints and LiDAR heights.
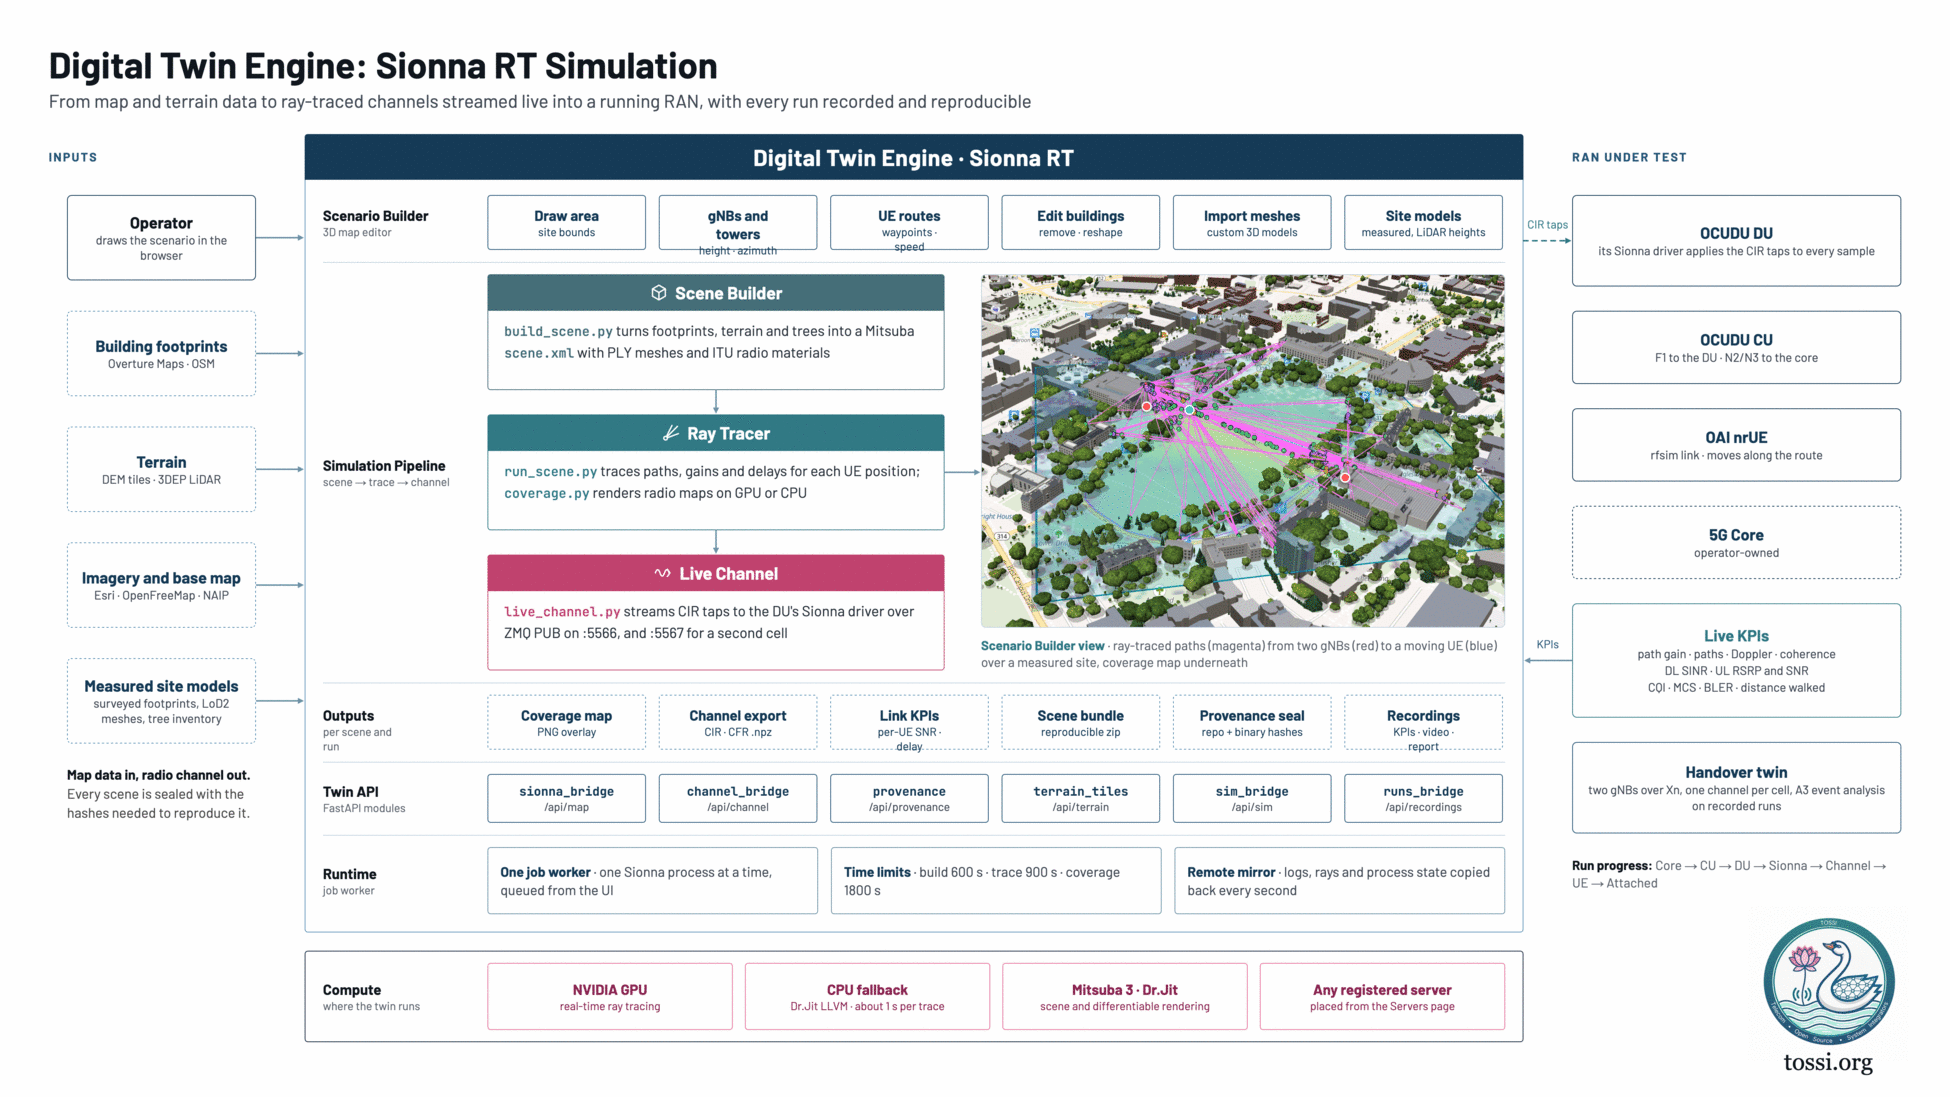
The digital twin engine, running from map and terrain data to ray-traced channels streamed live into a running RAN, with every run recorded and reproducible. On the left, the inputs are an operator who draws the scenario in the browser, building footprints from Overture Maps and OpenStreetMap, terrain from DEM tiles and 3DEP LiDAR, imagery and base maps from Esri, OpenFreeMap and NAIP, and measured site models carrying surveyed footprints, level-of-detail-2 meshes and a tree inventory. A note reads that map data goes in and a radio channel comes out, and that every scene is sealed with the hashes needed to reproduce it. The centre holds the engine. A Scenario Builder row, described as a 3D map editor, offers drawing the area as site bounds, placing gNBs and towers with height and azimuth, drawing UE routes with waypoints and speed, editing buildings to remove or reshape them, importing custom 3D meshes, and using measured site models with LiDAR heights. A simulation pipeline runs scene to trace to channel in three stages: a Scene Builder, where build_scene.py turns footprints, terrain and trees into a Mitsuba scene.xml with PLY meshes and ITU radio materials; a Ray Tracer, where run_scene.py traces paths, gains and delays for each UE position and coverage.py renders radio maps on GPU or CPU; and a Live Channel, where live_channel.py streams channel impulse response taps to the DU's Sionna driver over ZMQ publish on port 5566, and port 5567 for a second cell. Beside the pipeline, a Scenario Builder view shows a ray-traced campus scene with magenta paths drawn from two gNBs, marked red, to a moving UE, marked blue, over a measured site with a coverage map underneath. An outputs row, produced per scene and run, lists a coverage map as a PNG overlay, a channel export as CIR and CFR npz files, per-UE link KPIs covering SNR and delay, a reproducible scene bundle zip, a provenance seal carrying repository and binary hashes, and recordings holding KPIs, video and a report. A Twin API row lists the FastAPI modules sionna_bridge at api/map, channel_bridge at api/channel, provenance at api/provenance, terrain_tiles at api/terrain, sim_bridge at api/sim and runs_bridge at api/recordings. A runtime row records that one job worker runs a single Sionna process at a time, queued from the interface; that time limits are 600 seconds for build, 900 for trace and 1800 for coverage; and that a remote mirror copies logs, rays and process state back every second. On the right, the RAN under test comprises an OCUDU DU whose Sionna driver applies the CIR taps to every sample, an OCUDU CU connected by F1 to the DU and N2 and N3 to the core, an OAI nrUE on an rfsim link moving along the route, and an operator-owned 5G core. Live KPIs cover path gain, paths, Doppler, coherence, downlink SINR, uplink RSRP and SNR, CQI, MCS, BLER and distance walked. A handover twin runs two gNBs over Xn with one channel per cell and A3 event analysis on recorded runs. Run progress is listed as core, then CU, then DU, then Sionna, then channel, then UE, then attached. A compute band at the bottom records where the twin runs: an NVIDIA GPU for real-time ray tracing, a CPU fallback on Dr.Jit LLVM at about one second per trace, Mitsuba 3 with Dr.Jit for scene and differentiable rendering, and any registered server placed from the Servers page.
Figure 5: The digital twin end to end. Map and terrain data become a ray-traced scene, and the resulting channel taps stream into the DU of a running RAN.

From a built scene the platform ray traces each cell, computes a coverage map, reports per-link KPIs and exports the channel. A scene can be packaged as a self-contained bundle that reproduces it from the Sionna runtime alone.
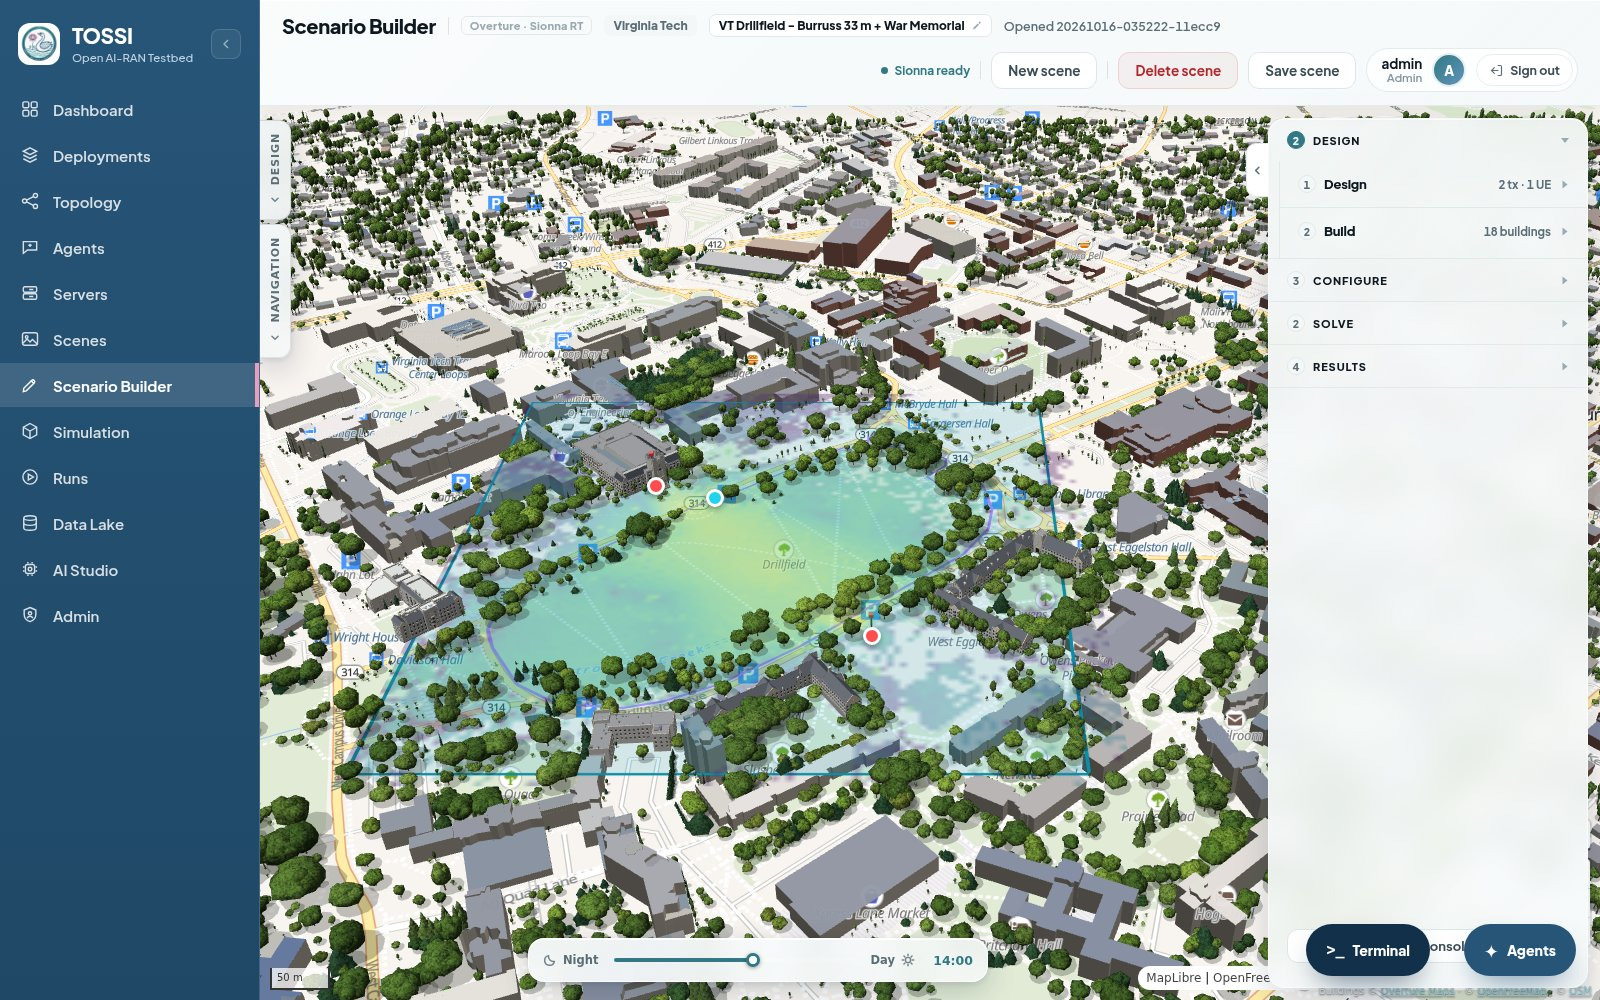
The Scenario Builder with the Design group open. The main area shows a 3D map of a university campus with buildings extruded, trees rendered individually and a terrain surface, with transmitter and receiver markers placed on it and a shaded coverage area between them. A header names the scene and shows that the Sionna runtime is ready, with controls for a new scene, deleting and saving. A right-hand panel steps through four numbered groups, Design, Build, Configure, Solve and Results, with the Design group expanded to show the transmitter and receiver counts and the number of buildings in the built scene. A day and night slider runs along the bottom of the map.
Figure 6: The Scenario Builder. An area is drawn on the map, transmitters and receivers placed, and the 3D scene built from map data or a measured site model.

RAN over a simulated channel

A real CU, DU and UE can be run with the radio channel between them computed live from a built scene. The DU's radio driver filters its transmit samples with the channel taps the ray tracer streams, so the protocol stack is unmodified and only the channel is synthetic. A GPU makes tracing real time; CPU tracing works through a software backend at lower rates.

A two-cell variant runs two gNBs connected over Xn, each with its own channel, and a receiver that walks between them, which exercises measurement-triggered handover. Recorded runs can be analysed against an A3 event model through the API to compare predicted and actual handovers.
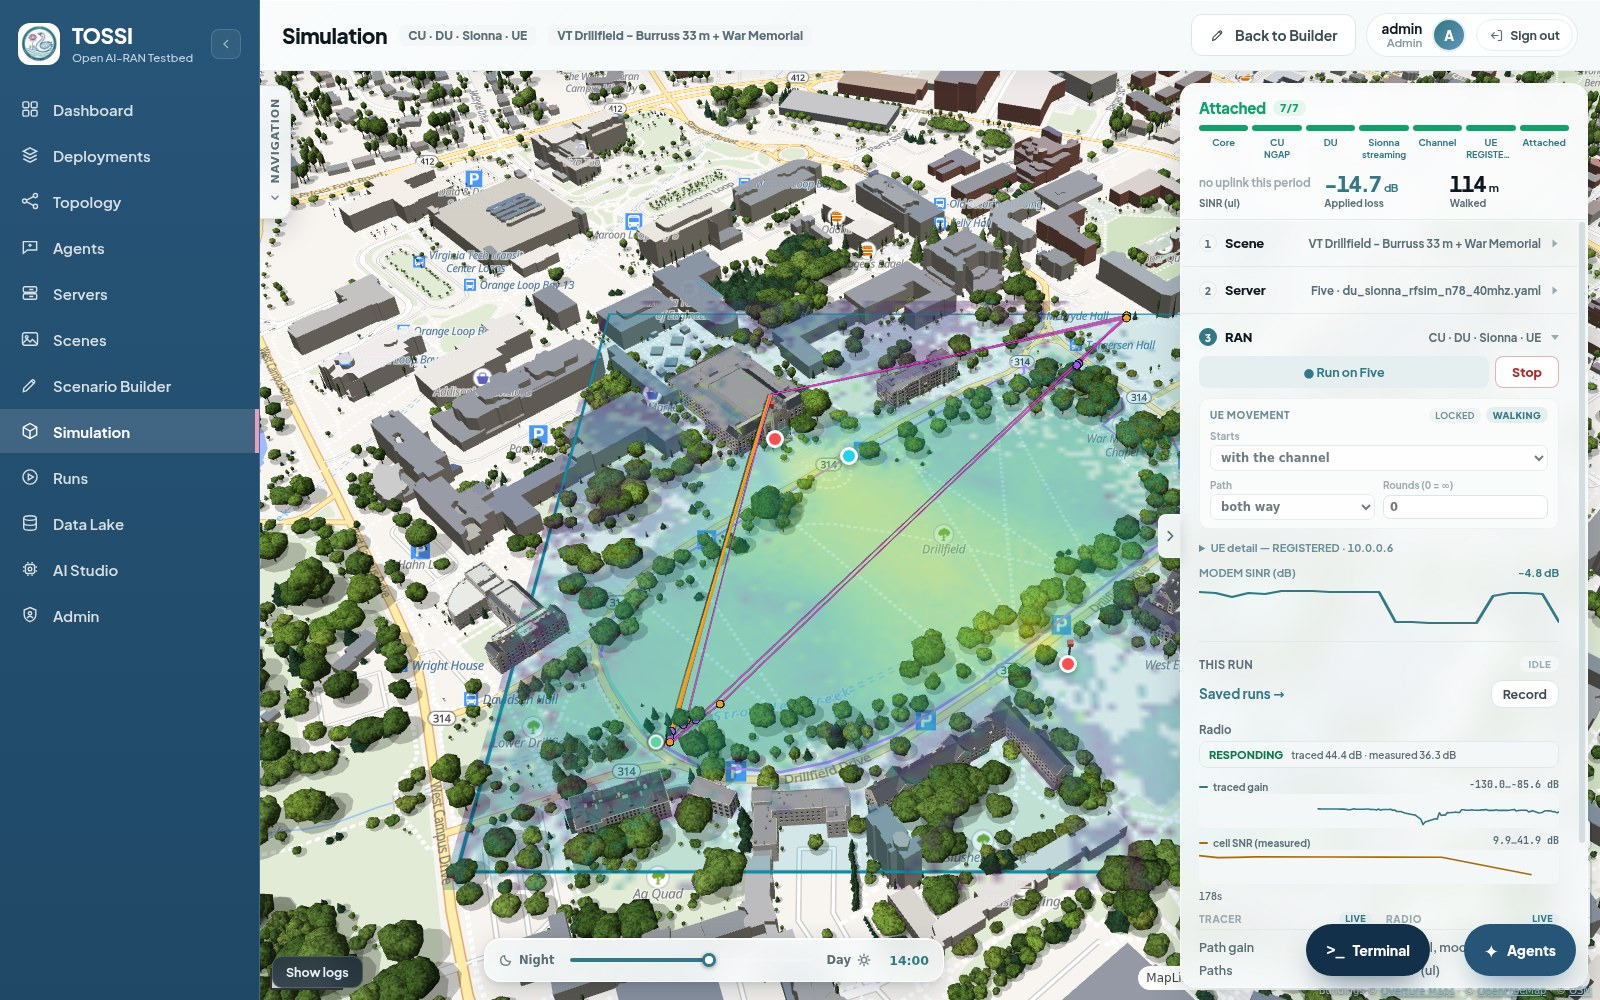
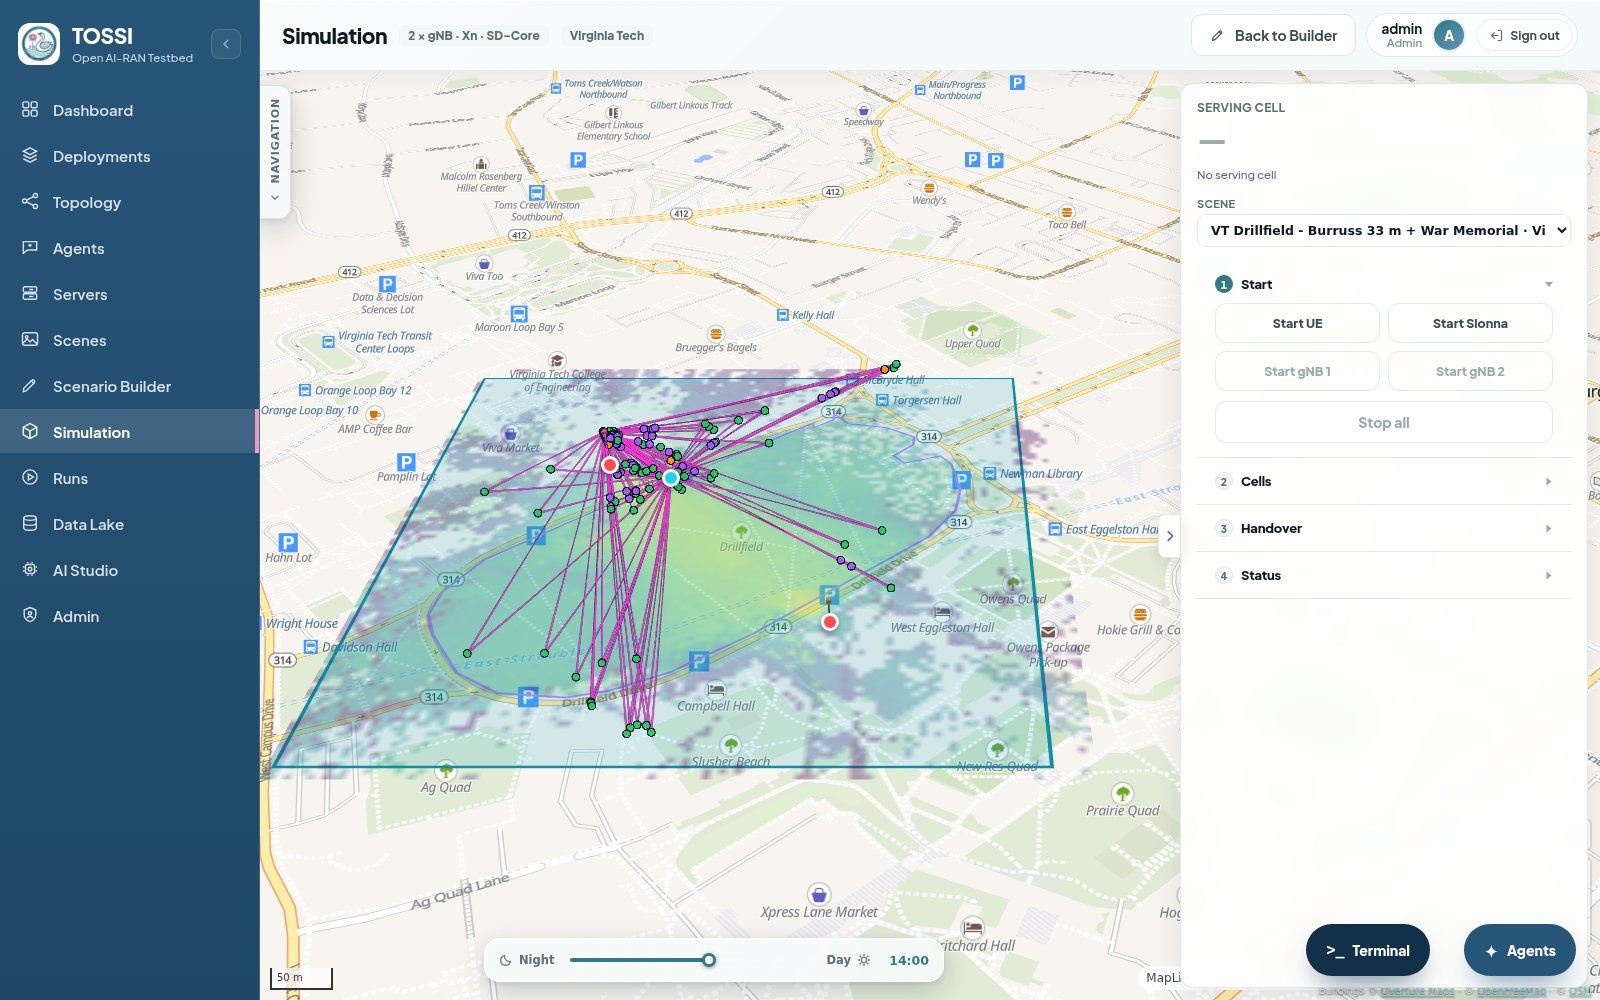
The Simulation page running a RAN over a ray-traced channel. The map shows the built campus scene with ray paths drawn between the transmitter and the walking receiver. A right-hand panel reports the run as Attached with all seven stages complete, naming them Core, CU NGAP, DU, Sionna streaming, Channel, UE registered and Attached, and gives the applied loss in decibels and the distance walked in metres. Below it, numbered sections select the scene, the server and the O-DU configuration, then a RAN section with a Run control and a Stop control. A UE movement block sets when movement starts, whether the route runs one way or both ways, and the number of rounds. Live readouts plot modem SINR, traced gain and measured cell SNR against time, and a tracer block reports path gain and path count.
Figure 7: A real CU, DU and UE running over a channel computed live from the scene. The tracer and radio readouts update as the receiver walks its route.

AI-RAN model lifecycle

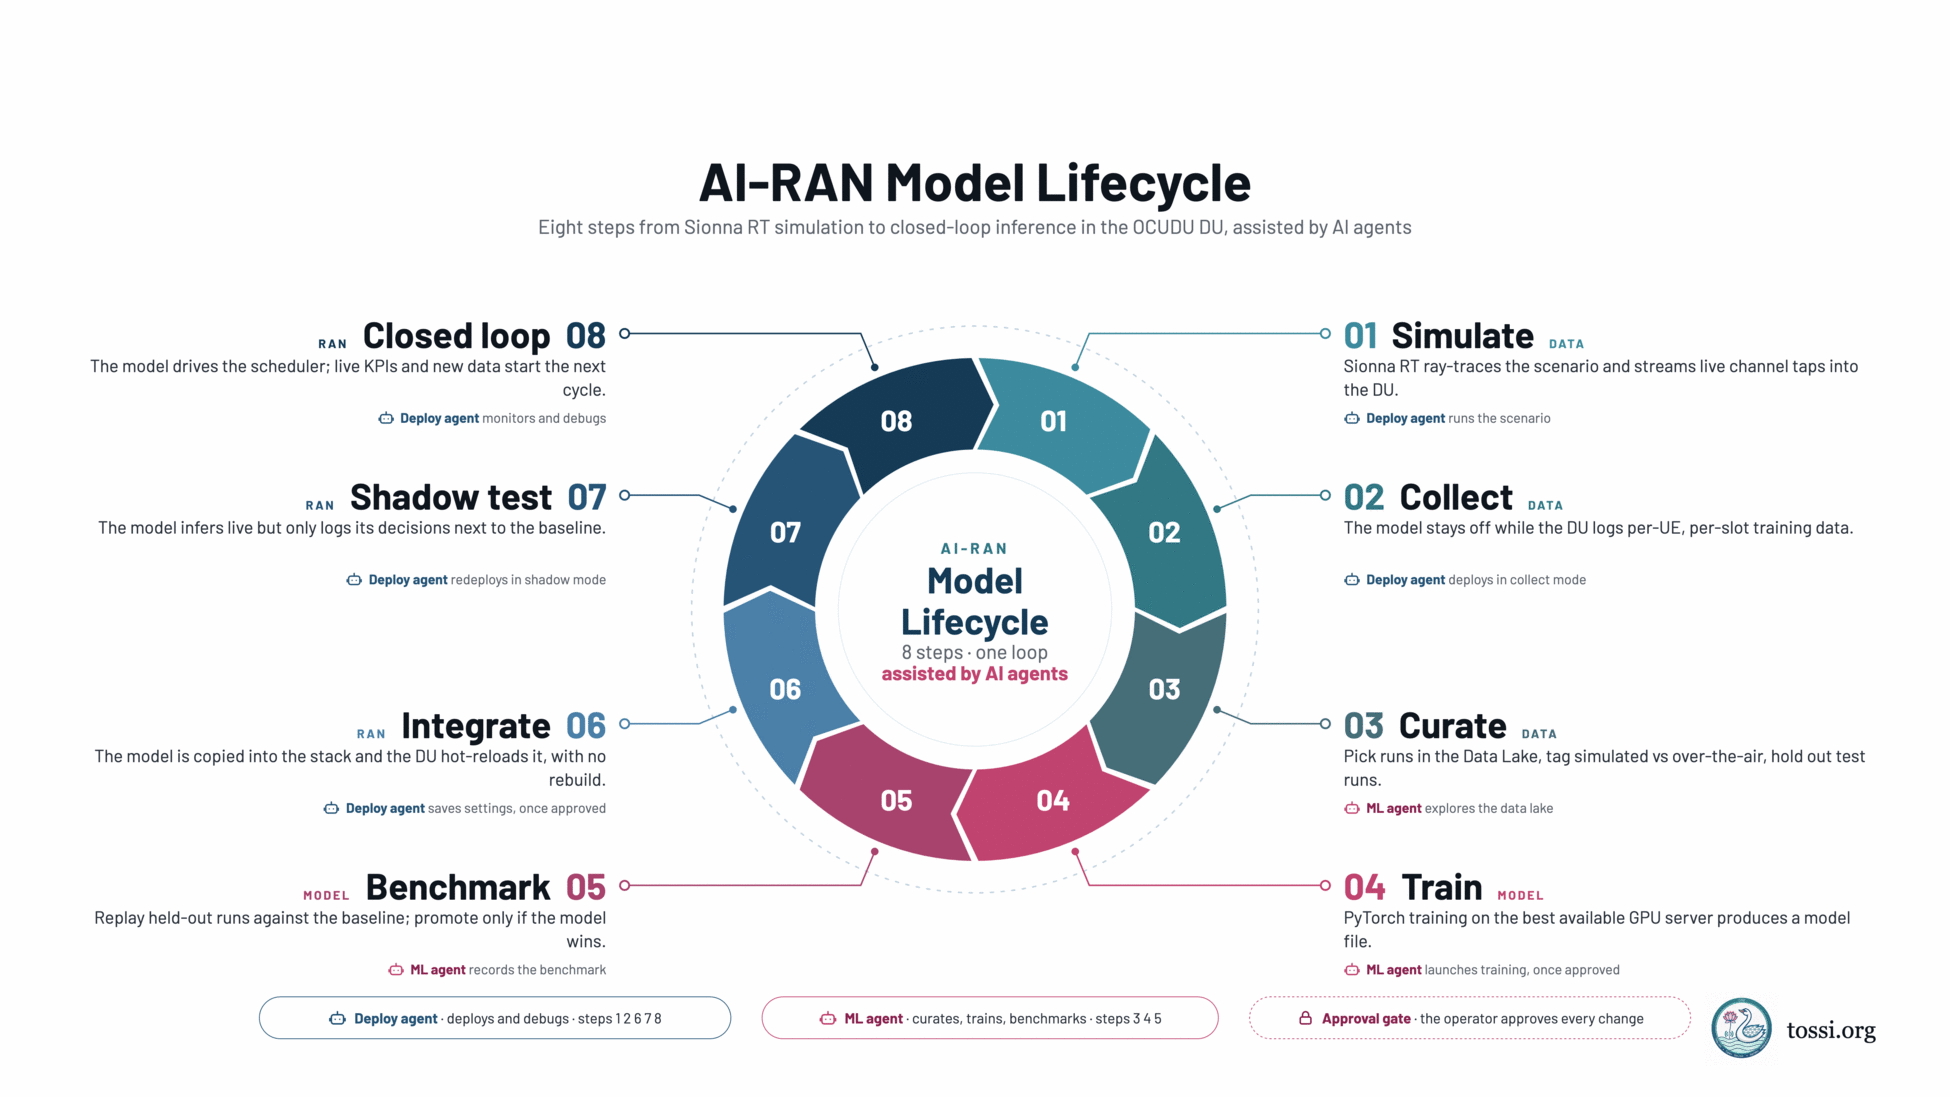
The AI-RAN model lifecycle as a ring of eight numbered steps, described as running from Sionna RT simulation to closed-loop inference in the OCUDU DU, assisted by AI agents. Step one, Simulate, tagged data: Sionna RT ray-traces the scenario and streams live channel taps into the DU, with the Deploy agent running the scenario. Step two, Collect, tagged data: the model stays off while the DU logs per-UE, per-slot training data, with the Deploy agent deploying in collect mode. Step three, Curate, tagged data: runs are picked in the Data Lake, tagged as simulated or over-the-air, and test runs held out, with the ML agent exploring the data lake. Step four, Train, tagged model: PyTorch training on the best available GPU server produces a model file, with the ML agent launching training once approved. Step five, Benchmark, tagged model: held-out runs are replayed against the baseline and the model is promoted only if it wins, with the ML agent recording the benchmark. Step six, Integrate, tagged RAN: the model is copied into the stack and the DU hot-reloads it with no rebuild, with the Deploy agent saving settings once approved. Step seven, Shadow test, tagged RAN: the model infers live but only logs its decisions next to the baseline, with the Deploy agent redeploying in shadow mode. Step eight, Closed loop, tagged RAN: the model drives the scheduler, and live KPIs and new data start the next cycle, with the Deploy agent monitoring and debugging. Three legends record that the Deploy agent deploys and debugs at steps one, two, six, seven and eight, the ML agent curates, trains and benchmarks at steps three, four and five, and an approval gate means the operator approves every change.
Figure 8: The lifecycle as one loop. Simulation feeds collection, curated data trains a model, and a model is integrated only after it beats the baseline on held-out runs.

Each AI-RAN stack runs a DU with one machine-learning feature built in, and the model is a file the DU loads. A mode setting selects the stage:

ModeBehaviour
collectLogs a dataset. The model is not used. This is the default
shadowRuns the model and logs its decision beside the baseline, without acting on it
closed-loopApplies the model's decision

Dataset logging stays on in every mode. The DU reloads the model file whenever it changes, so a retrained model requires no rebuild and no restart. The progression from collect to shadow to closed-loop is followed without skipping a stage, training uses data collected with inference off, and a model is promoted only when it beats the baseline on held-out runs.

Operator agents

Three LLM agents are available, covering deployment, machine learning and general questions about the testbed. Each calls the same functions as the API.

Read-only tools run immediately. Any tool that changes state pauses for approval, and shell commands run with elevated privileges always require a manual approval. Every tool call is written to an audit log.
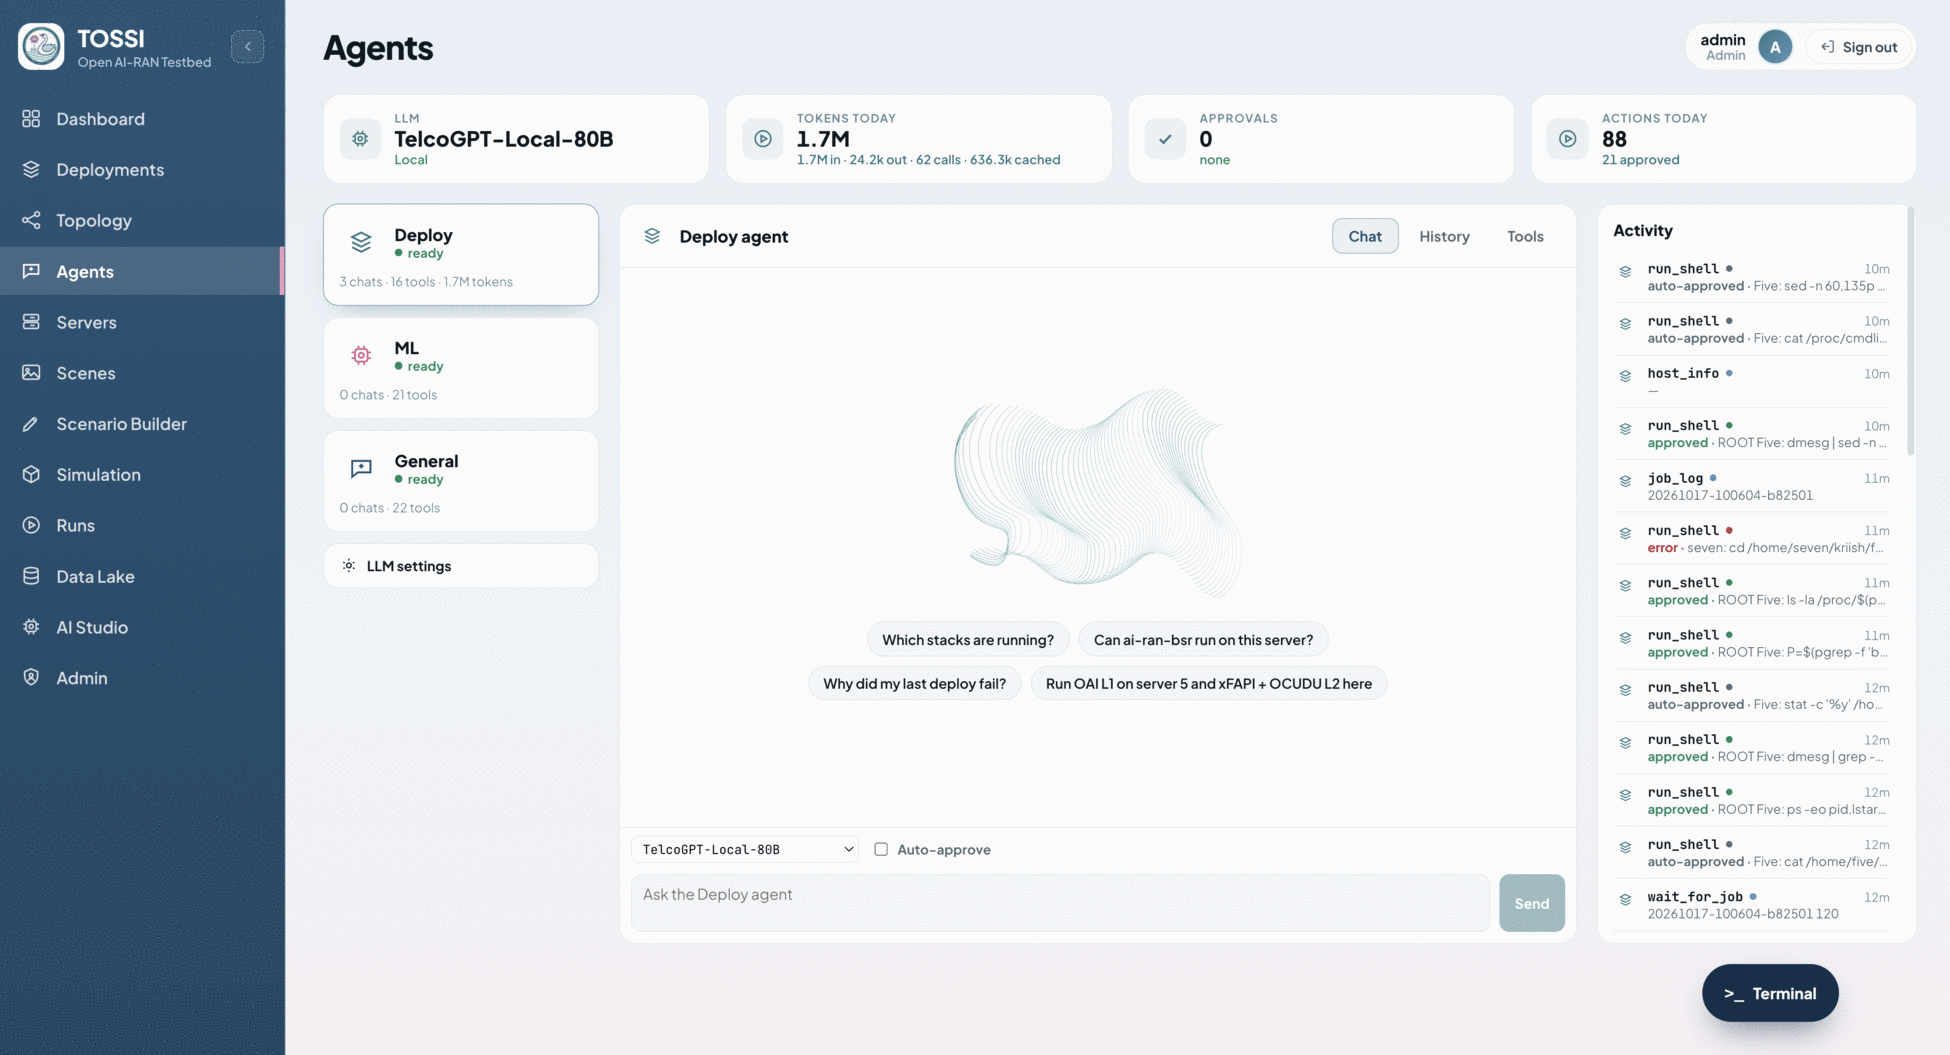
The Agents page. A conversation with the Deploy agent runs down the centre, with the agent's tool calls shown inline as it works. A right-hand panel lists the available tools, each marked as either read-only, which runs immediately, or as one that asks first. An approval prompt is shown for an action that would change state, offering Approve and Deny. Controls at the bottom select the provider and model and toggle auto-approve.
Figure 9: The agent view. Read-only tools run immediately; anything that changes state pauses for an explicit approval.

Architecture

The platform divides into a control plane, three engines, the RAN data plane and a deployment model.
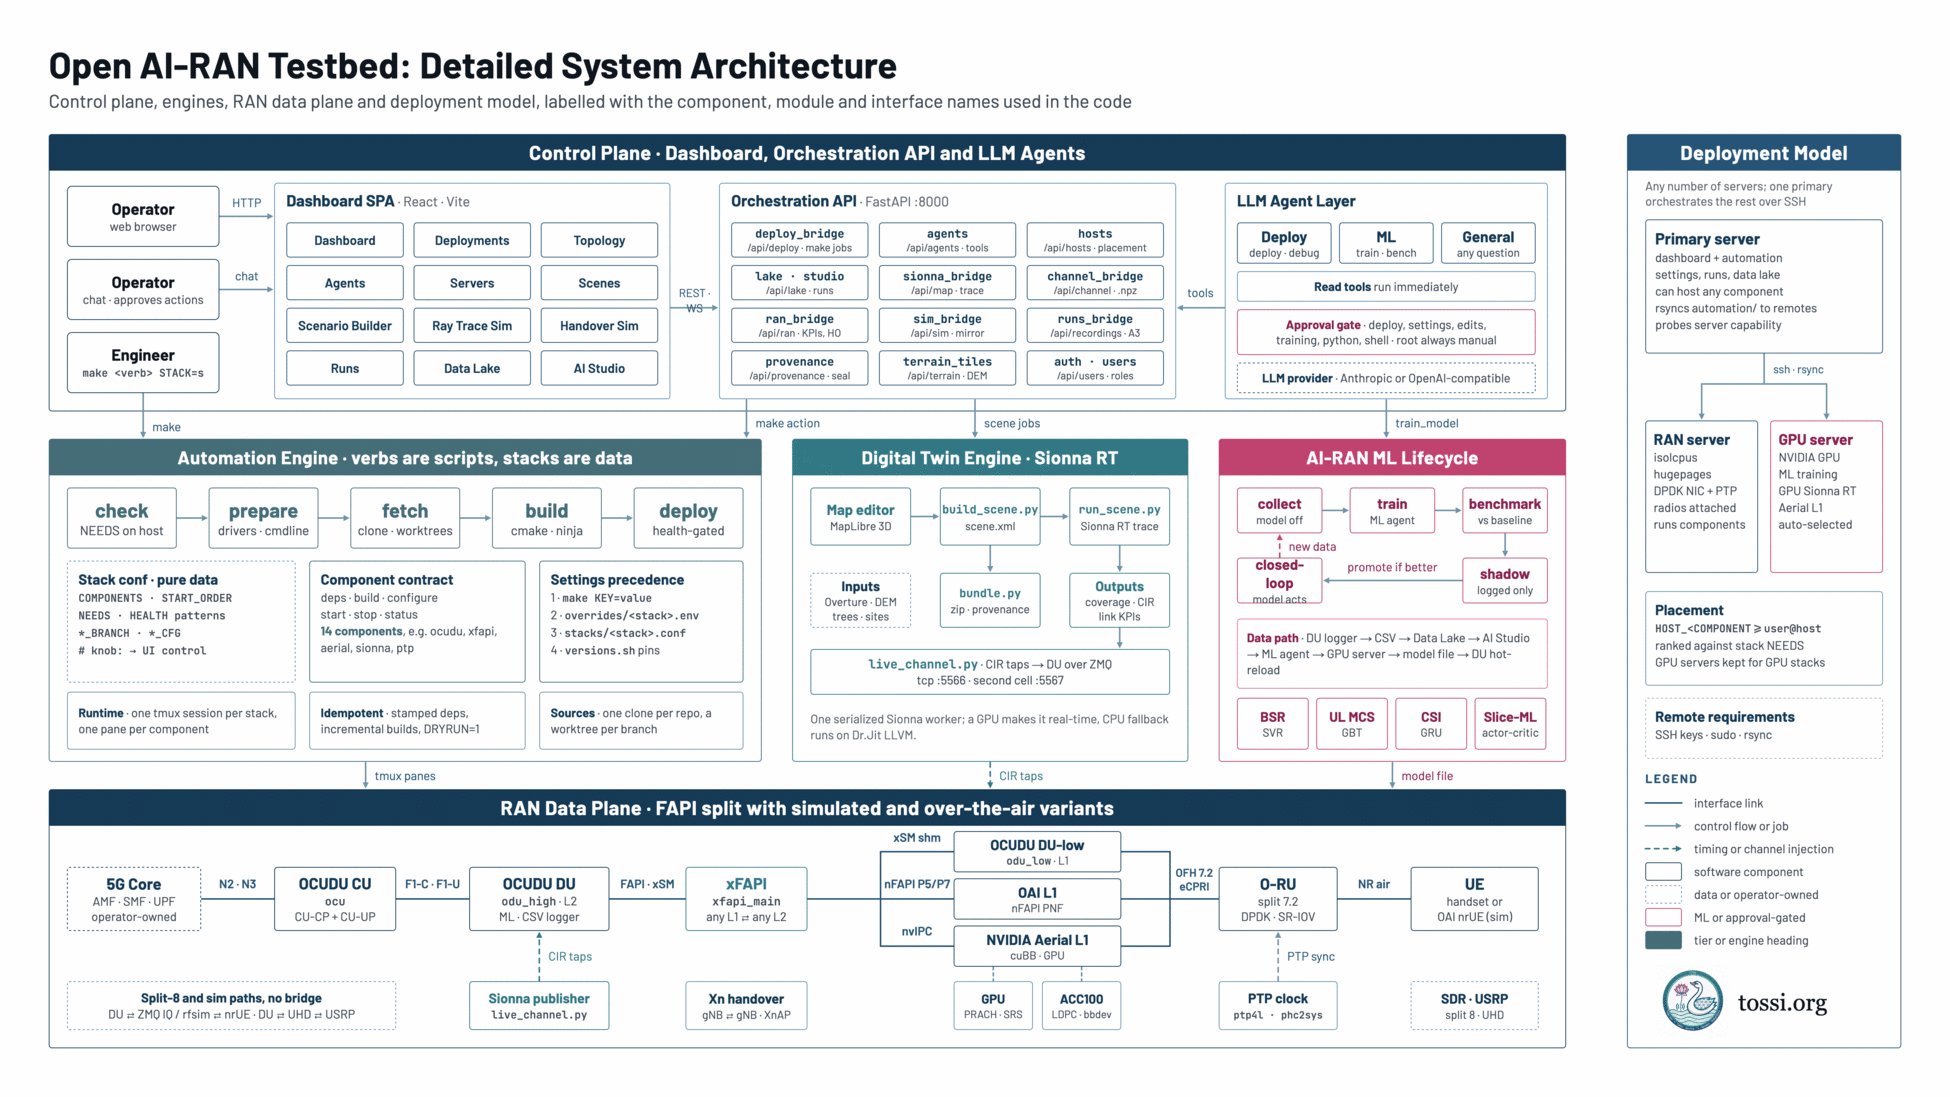
Detailed system architecture of the Open AI-RAN Testbed, labelled with the component, module and interface names used in the code. The control plane band holds three parts. A Dashboard single-page application built with React and Vite, reached by an operator over HTTP, with pages for Dashboard, Deployments, Topology, Agents, Servers, Scenes, Scenario Builder, Ray Trace Sim, Handover Sim, Runs, Data Lake and AI Studio. An Orchestration API on FastAPI port 8000, reached over REST and WebSocket, exposing deploy_bridge at api/deploy for make jobs, agents at api/agents for tools, hosts at api/hosts for placement, lake and studio at api/lake for runs, sionna_bridge at api/map for trace, channel_bridge at api/channel for npz, ran_bridge at api/ran for KPIs and handover, sim_bridge at api/sim for mirror, runs_bridge at api/recordings for A3, provenance at api/provenance for seal, terrain_tiles at api/terrain for DEM, and auth and users at api/users for roles. An LLM Agent Layer with Deploy, ML and General agents, where read tools run immediately and an approval gate covers deploy, settings, edits, training, python and shell, with root always manual, backed by an Anthropic or OpenAI-compatible provider. Below, three engines. The Automation Engine, where verbs are scripts and stacks are data, runs check against NEEDS on host, prepare for drivers and command line, fetch for clone and worktrees, build with cmake and ninja, and a health-gated deploy; its stack conf is pure data listing COMPONENTS, START_ORDER, NEEDS and HEALTH patterns; its component contract is deps, build, configure, start, stop and status across 14 components; settings precede in the order make KEY equals value, then overrides per stack env, then stacks per stack conf, then versions.sh pins; the runtime is one tmux session per stack with one pane per component; builds are idempotent with stamped deps and incremental builds; and sources are one clone per repo with a worktree per branch. The Digital Twin Engine on Sionna RT runs a MapLibre 3D map editor into build_scene.py producing scene.xml, then run_scene.py performing the Sionna RT trace, with inputs from Overture, a DEM, trees and sites, a bundle.py producing a zip with provenance, and outputs of coverage, channel impulse response and link KPIs; live_channel.py taps the CIR to the DU over ZMQ on TCP 5566 with a second cell on 5567; one serialized Sionna worker runs, a GPU makes it real-time and CPU fallback runs on Dr.Jit LLVM. The AI-RAN ML Lifecycle runs collect with the model off, train with the ML agent, and benchmark against the baseline, promoting if better into shadow which is logged only, then closed-loop where the model acts; the data path runs DU logger to CSV to Data Lake to AI Studio to ML agent to GPU server to model file to DU hot-reload; the four models are BSR using SVR, UL MCS using GBT, CSI using GRU and Slice-ML using actor-critic. The RAN Data Plane band shows the FAPI split with simulated and over-the-air variants: an operator-owned 5G core with AMF, SMF and UPF connects over N2 and N3 to an OCUDU CU holding CU-CP and CU-UP, which connects over F1-C and F1-U to an OCUDU DU holding the high DU, L2, ML and a CSV logger, which connects over FAPI and xSM to xFAPI, bridging any L1 to any L2; xFAPI reaches an OCUDU DU-low L1 over xSM shared memory, an OAI L1 nFAPI PNF over nFAPI P5 and P7, or an NVIDIA Aerial L1 on cuBB GPU over nvIPC; these reach an O-RU at split 7.2 with DPDK and SR-IOV over Open Fronthaul 7.2 and eCPRI, and then a handset or simulated OAI nrUE over the NR air interface. Supporting blocks show split-8 and simulated paths with no bridge, a Sionna publisher feeding CIR taps into the DU, Xn handover between gNBs over XnAP, a GPU for PRACH and SRS, an ACC100 for LDPC via bbdev, a PTP clock running ptp4l and phc2sys, and an SDR USRP at split 8 over UHD. On the right, a deployment model panel states that any number of servers may be used with one primary orchestrating the rest over SSH; the primary server runs the dashboard and automation, holds settings, runs and the data lake, can host any component, rsyncs automation to remotes and probes server capability; a RAN server provides isolcpus, hugepages, a DPDK NIC with PTP, attached radios and runs components; a GPU server provides an NVIDIA GPU for ML training, GPU Sionna RT and Aerial L1, and is auto-selected; placement uses HOST_COMPONENT set to user at host, ranked against stack NEEDS, with GPU servers kept for GPU stacks; remote requirements are SSH keys, sudo and rsync. A legend distinguishes interface links, control flow or job, timing or channel injection, software components, data or operator-owned blocks, ML or approval-gated blocks, and tier or engine headings.
Figure 10: The same platform with the module and interface names used in the code. The control plane drives three engines; the RAN data plane covers the FAPI split with both simulated and over-the-air variants.

Deployment guide

Prerequisites

One Linux server is enough to begin. Additional servers can be registered later and are required only for the capabilities they provide.

  • A Linux host with the build dependencies of the stacks to be deployed.
  • Passwordless sudo, since RAN components bind interfaces and set real-time priorities.
  • A Python interpreter with the Sionna runtime installed, for the digital twin features.
  • For remote servers: key-based SSH from the primary, passwordless sudo, and rsync.
  • Optional per stack: isolated CPU cores and hugepages, a DPDK-capable NIC, PTP, a hardware accelerator, or a GPU.

Get the source

The platform, its automation engine and the stack catalogue live in one repository:

git clone -b main https://github.com/TOSSI-Foundation/Open-AIRAN-Testbed.git
cd Open-AIRAN-Testbed

Starting the platform

Then, from the repository root:

make dashboard

On first run this creates the backend environment, installs the frontend packages, builds the interface and serves the whole application from a single port. The main settings are given as environment variables:

VariableDefaultEffect
PORT8000Listening port
HOST0.0.0.0Bind address. A loopback address keeps the platform on one machine
TOSSI_PASSWORDgeneratedWorkspace password
TOSSI_SIONNA_PYTHONper installPython interpreter carrying the Sionna runtime

Accounts and roles

Accounts are stored with hashed passwords. Three roles are available:

RolePermitted
adminEverything, including accounts, roles and password resets
operatorEverything except managing accounts
viewerReads every page. Action controls are hidden and the API refuses writes

Registering servers

The server running the platform is the primary. Others are added once and can then run any component of any stack, or run model training.

Adding a server takes a nickname, a user, an address and a port, and either a password used once to install the primary's public key, or a key the operator installs themselves. A connection test and a capability probe run automatically, and the result is shown as a set of badges covering DPDK, PTP, accelerator, container runtime and privilege escalation. A server cannot be removed while it still runs part of a stack.

Usage guide

Navigating the interface

The sidebar groups the platform by task.

PagePurpose
DashboardAgent activity, the latest scene, machine health, models and data, and recent runs
DeploymentsCheck, build, deploy, stop and train stacks, edit configuration, read logs
TopologyEach running stack drawn as a network, with interface labels and live KPIs
AgentsChat with the agents, approve their actions and configure the provider
ServersRegister servers, check their capabilities and open a terminal
ScenesThe library of scenes built in the Scenario Builder
Scenario BuilderDraw an area, place transmitters and receivers, build the scene, trace and compute coverage
SimulationRun a RAN over a ray-traced channel, or a two-cell handover
RunsHistory of stack deployments and simulation recordings
Data LakeEvery run's logs and datasets, by stack, with selection for training
AI StudioDatasets, models and benchmarks, with the ML agent alongside

While a job runs, every page shows which stack and action are running, the progress, the current step, a timer and controls to view the log or cancel. A terminal and the agent chat are available from any page.
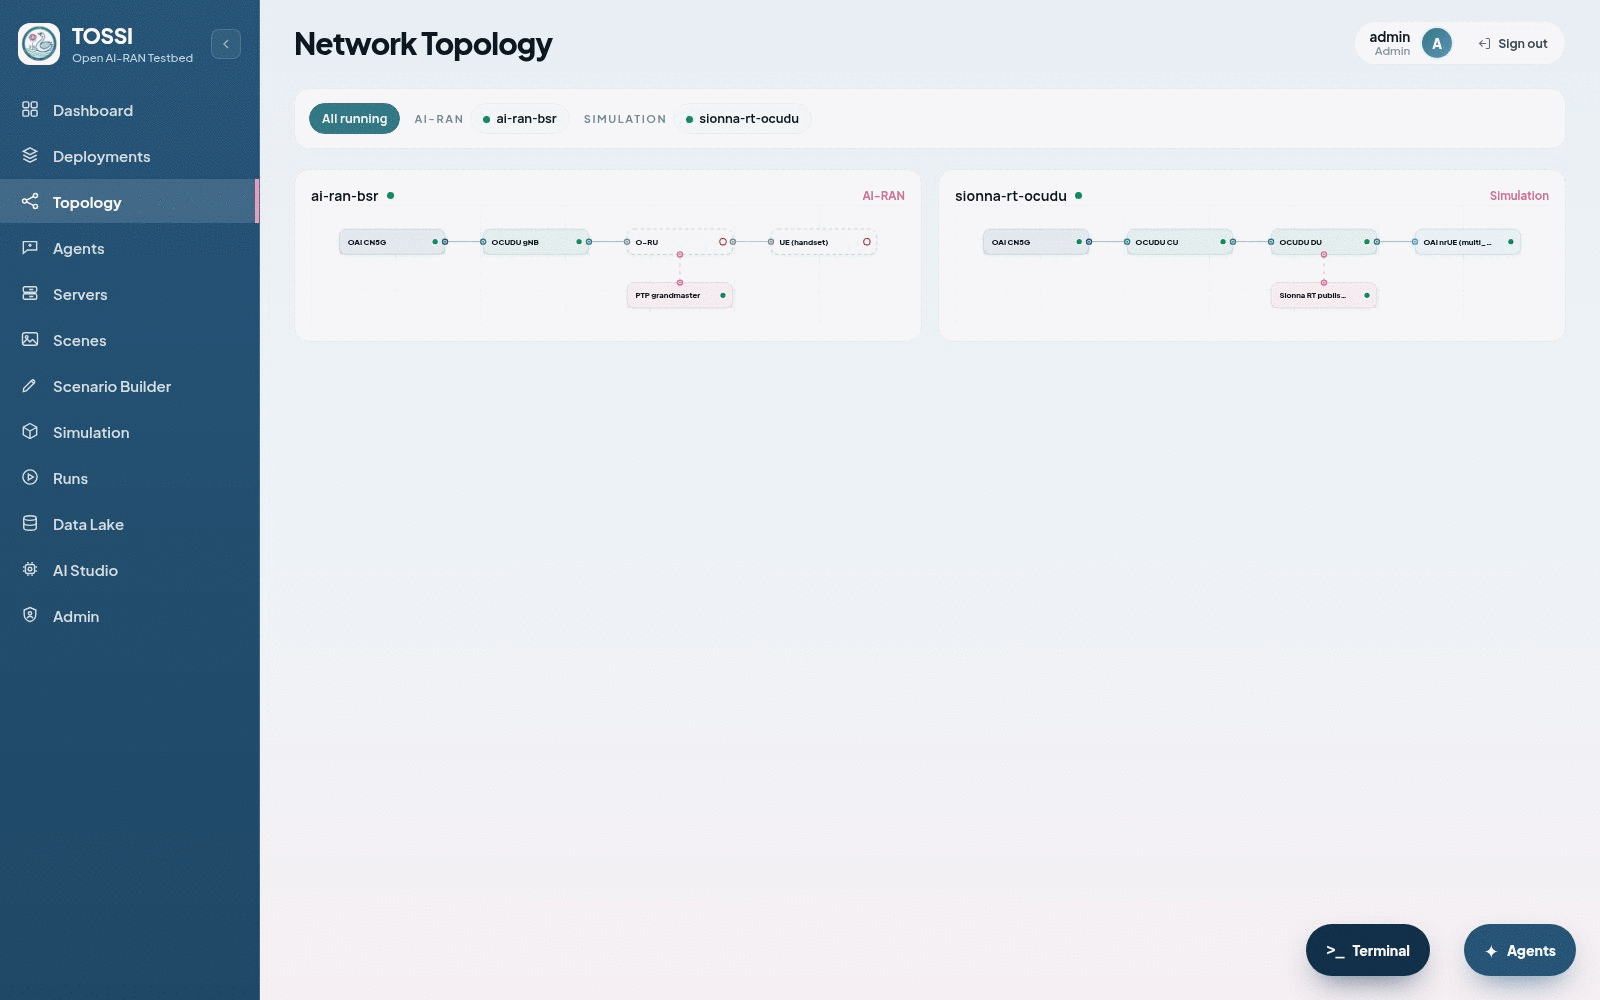
The Network Topology page showing two running stacks side by side, one an AI-RAN stack and the other a simulation stack. Each is drawn as a row of linked nodes running from the 5G core through the CU and DU to the radio and the UE, with each link labelled by its interface and each node carrying a status dot. The AI-RAN stack additionally shows a PTP grandmaster node, and the simulation stack shows a Sionna publisher node feeding the DU. Filter chips at the top switch between all running stacks and each individual stack.
Figure 11: Topology draws each running stack from its configuration, with every link labelled by the interface that carries it.

Running stacks

Stacks are deployed, configured and inspected from the Deployments page, or from the shell with the same targets.

Deploying a stack

Select the stack, then the server it should run on. Servers that cannot meet the stack's requirements are shown as unavailable with the reason. The actions are:

ActionRunsNotes
Checkmake checkVerifies only the capabilities the stack declares
Buildmake buildChanging a setting that affects compilation resets the built state
Deploymake deployStarts components in order and waits for each health pattern
Run allmake allInstall, then build, then deploy
Trainmake trainOnly on stacks that define a training target
Stopmake stopStops this stack's components, never the core

One job runs at a time. The exception is stopping a different stack, which is always permitted.

A first deployment follows a fixed order: deploy a core stack; run Check on the RAN stack and resolve anything it reports; review the configuration; run Run all and watch the job log; then confirm on the components view that each component reports as up.

The equivalent from a shell:

make list
make check  STACK=<stack>            # FIX=1 to remediate
make all    STACK=<stack>
make status
make stop   STACK=<stack>
DRYRUN=1 make all STACK=<stack>      # print the steps, run nothing

Placing one component on another server writes a host variable into the stack's settings file, which the dashboard and the command line both read:

echo 'HOST_<COMPONENT>=user@server' >> var/overrides/<stack>.env
make all STACK=<stack>

Configuring a stack

Per-stack settings are held in one overrides file shared with the command line. The configuration view exposes them as:

  • Knobs declared by the stack itself, such as the radio front end, the ML mode or the gNB layout.
  • Configuration files for the radio, CU, DU, UE, core and timing. These can be edited in place, with the previous version backed up, or copied to a stack-local path.
  • 5G core selection and the parameters the RAN needs from it, taken from core defaults, from the operator's own files, or entered directly.
  • Source selection between an upstream clone and a local tree, with an option to reuse an existing build.
  • Servers, one choice per component.

Each deployment exposes its job log, the per-component state and log, any output datasets, and the history of past jobs with the settings each ran with.
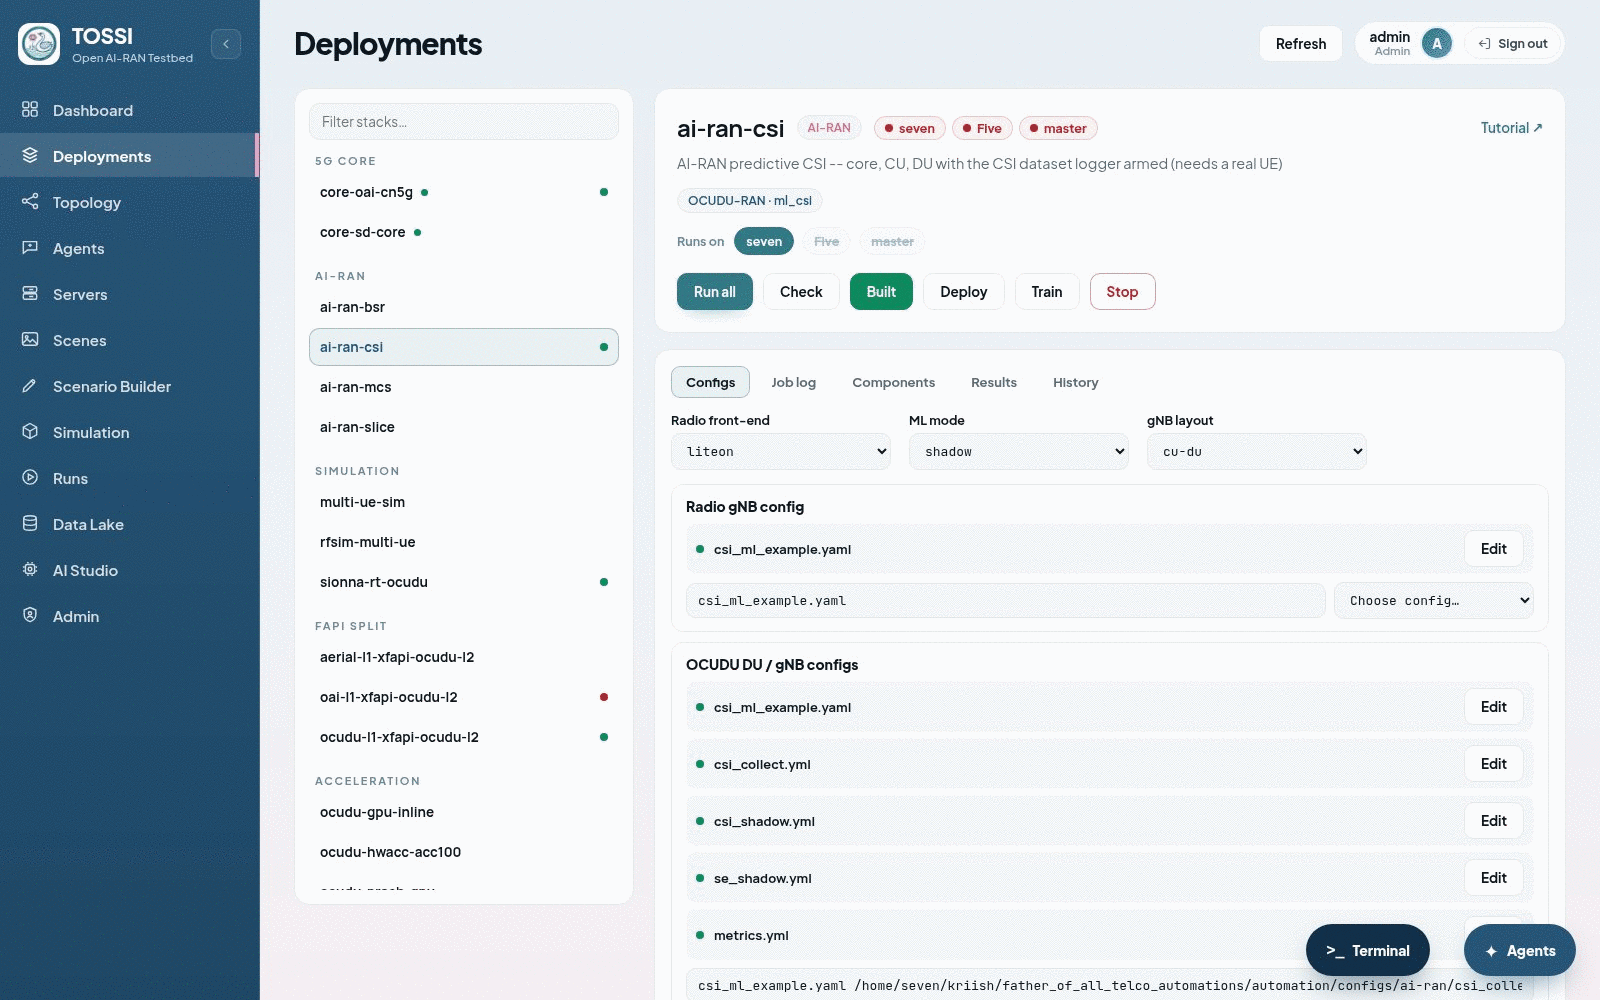
The Deployments page with the Configs tab open. Knobs declared by the stack appear at the top as labelled selectors. Below them, a list of configuration files covers the radio gNB, the OCUDU DU and CU, the UE, the 5G core compose file and PTP, each with a path field, a control to choose a different file, and controls to edit the file or save a stack-local copy. A 5G core section selects between the bundled cores and an external one, with fields for the AMF address, PLMN, TAC and slice identifiers. Further sections select the source tree and assign each component to a server.
Figure 12: Per-stack configuration. These settings are written to one overrides file that the command line reads too, so both interfaces stay in agreement.

Simulating

A scene is built once in the Scenario Builder, then used by either simulation mode.

Building a scene

Scenes are created in the Scenario Builder and listed in the scene library. The side panel works top to bottom through four groups:

GroupWhat it sets
DesignThe area, transmitters, receivers and a movement route. Building heights are editable and custom meshes can be imported
BuildThe minimum footprint and ground model, and whether to include terrain, open building data and foliage
ConfigureThe propagation model and bounce count, the antenna pattern and array, the receivers and their movement, and the DU config the channel feeds
Solve and resultsRay tracing per cell, a coverage map, the per-link KPIs, a channel export, and optionally a reproducible scene bundle

Build, trace and coverage run as jobs on a single worker, one at a time, so concurrent requests cannot exhaust GPU memory. Each has a time limit, and a job console reports progress and allows cancellation.

Running a RAN over a simulated channel

The simulation view runs a real CU, DU and UE with the channel between them computed live from a built scene. It does not start processes itself: it deploys the corresponding stack through the normal deployment path, passing the selected scene and DU configuration for that run.

The prerequisites are a built scene, a running core, the simulation stack deployed successfully at least once on the intended server, no other job in progress, and a DU configuration whose sample rate matches what the ray tracer publishes. A GPU is needed for real-time tracing.

Set the receiver movement before starting: when movement begins, whether the route runs one way or both, and how many laps. Progress is tracked through the core, CU, DU, tracer, channel, UE and attach stages, and the live readouts cover path gain, path count, trace time, Doppler and coherence from the tracer, and SINR, RSRP, SNR, CQI, MCS and block error counts from the radio.

When the stack runs on another server the platform mirrors that server's logs, ray geometry and process state, so the live views behave as though the run were local. Every simulation is recorded from the moment it starts.
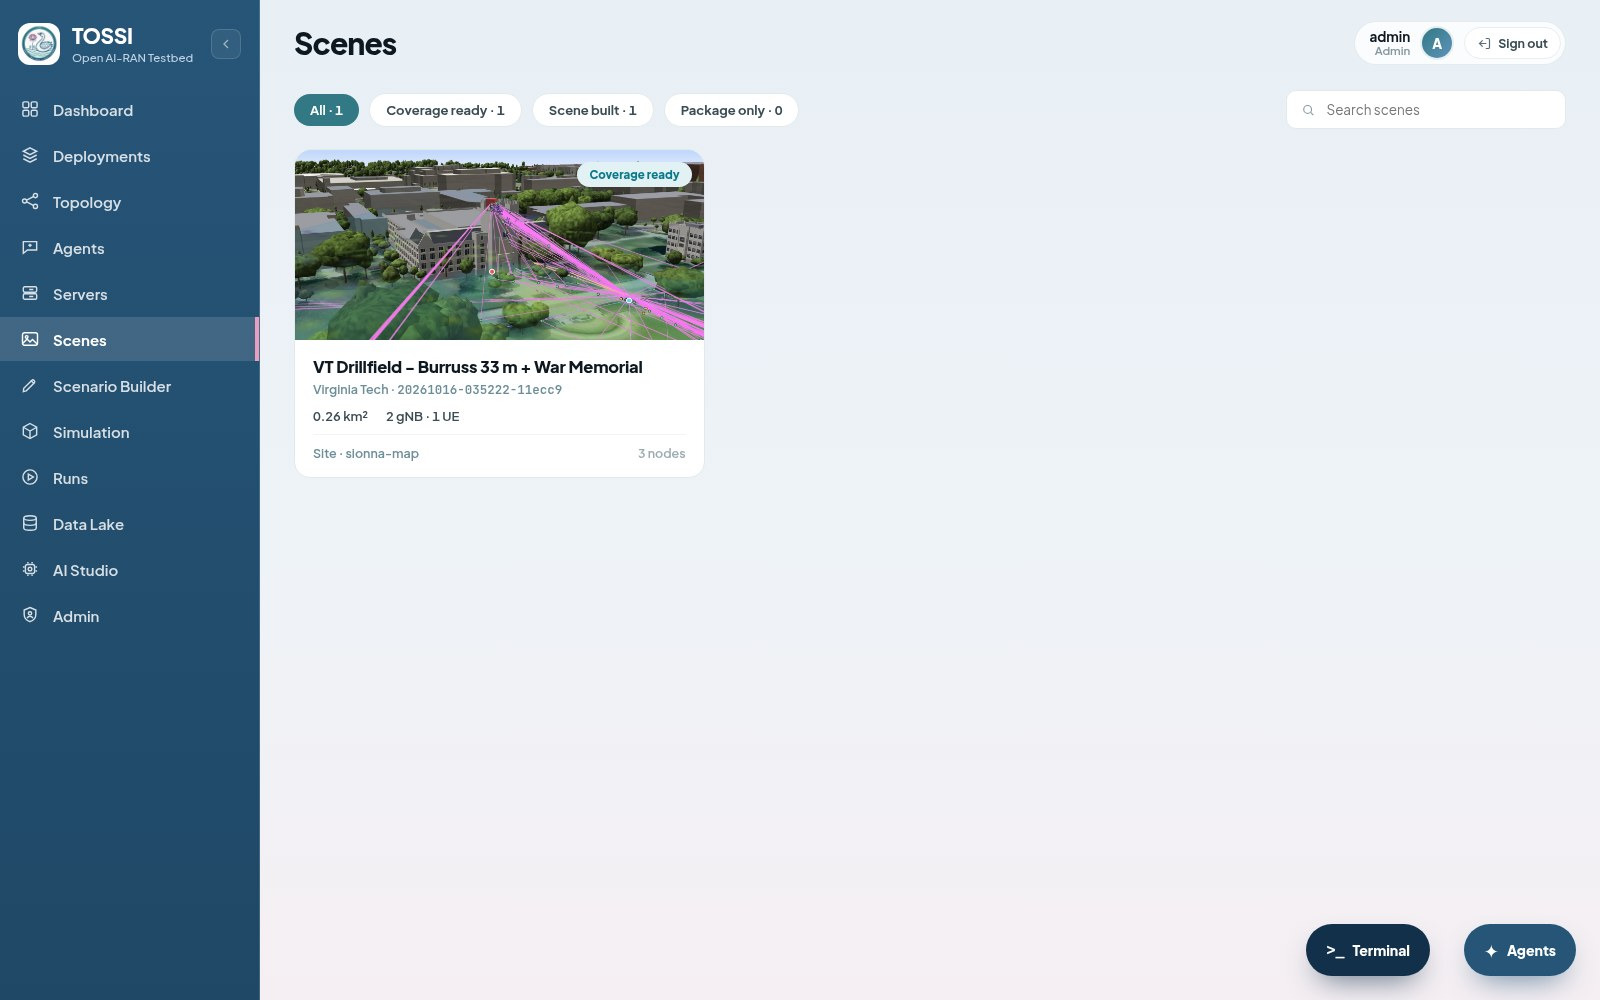
The Scenes page, a library of built scenes shown as cards. Each card carries a preview of the scene, its name and city, the scene identifier, the covered area, the number of transmitters and receivers, and a status badge reading coverage ready, scene built or package only. Controls on each card open the scene in the Builder, in the ray trace simulation or in the handover simulation, and allow it to be renamed or deleted.
Figure 13: The scene library. A built scene can be opened directly in either simulation mode.

Handover simulation

The handover view runs two cells connected over Xn, each with its own channel, and a receiver that walks between them. It requires a scene with two transmitters and a route, and a running core.

Start the receiver, then both cells, then the channel publisher, which streams one channel per cell. Confirm that both cells report core connectivity, the Xn link and which is serving. A handover can then be forced, or left to occur on its own as the receiver walks, since measurement-triggered handover is enabled in both cell configurations. The outcome is reported as completed, failed, in progress or unknown.

Recorded runs can be compared against an A3 event model through the API, which returns the predicted events, the actual events parsed from the CU log, and a comparison including ping-pongs.
The Simulation page running a two-cell handover. The map shows the scene with two transmitters, their ray paths drawn in different colours, and a receiver partway along its route between them. A right-hand panel starts the receiver, then each of the two cells, then the channel publisher, and reports for each cell whether it has reached the core, whether the Xn link is up and which cell is currently serving. A handover section offers a control to force a handover to either cell and reports the outcome, and a status block gives the cells up, the channel state and the distance walked.
Figure 14: Two cells over Xn with a receiver walking between them. Handovers occur on their own as it moves, or can be forced.

Data and models

Every run is recorded. Its datasets feed training, and a trained model returns to the DU through the lifecycle above.

Reviewing runs and datasets

Stack deployments and simulation recordings are listed together, filterable by type and stack, with their duration, outcome, servers and the data and logs each produced. A stack run opens when it is deployed and closes when it is stopped, at which point the datasets written during the run and the tail of each log are copied into the run record.

The data lake presents one entry per stack with its runs, files, row counts and total size. Each run records its outcome, duration, source branch, host and every setting it ran with, and each file can be previewed or downloaded. Datasets are matched to features by file name, and a selection can be carried directly into training.
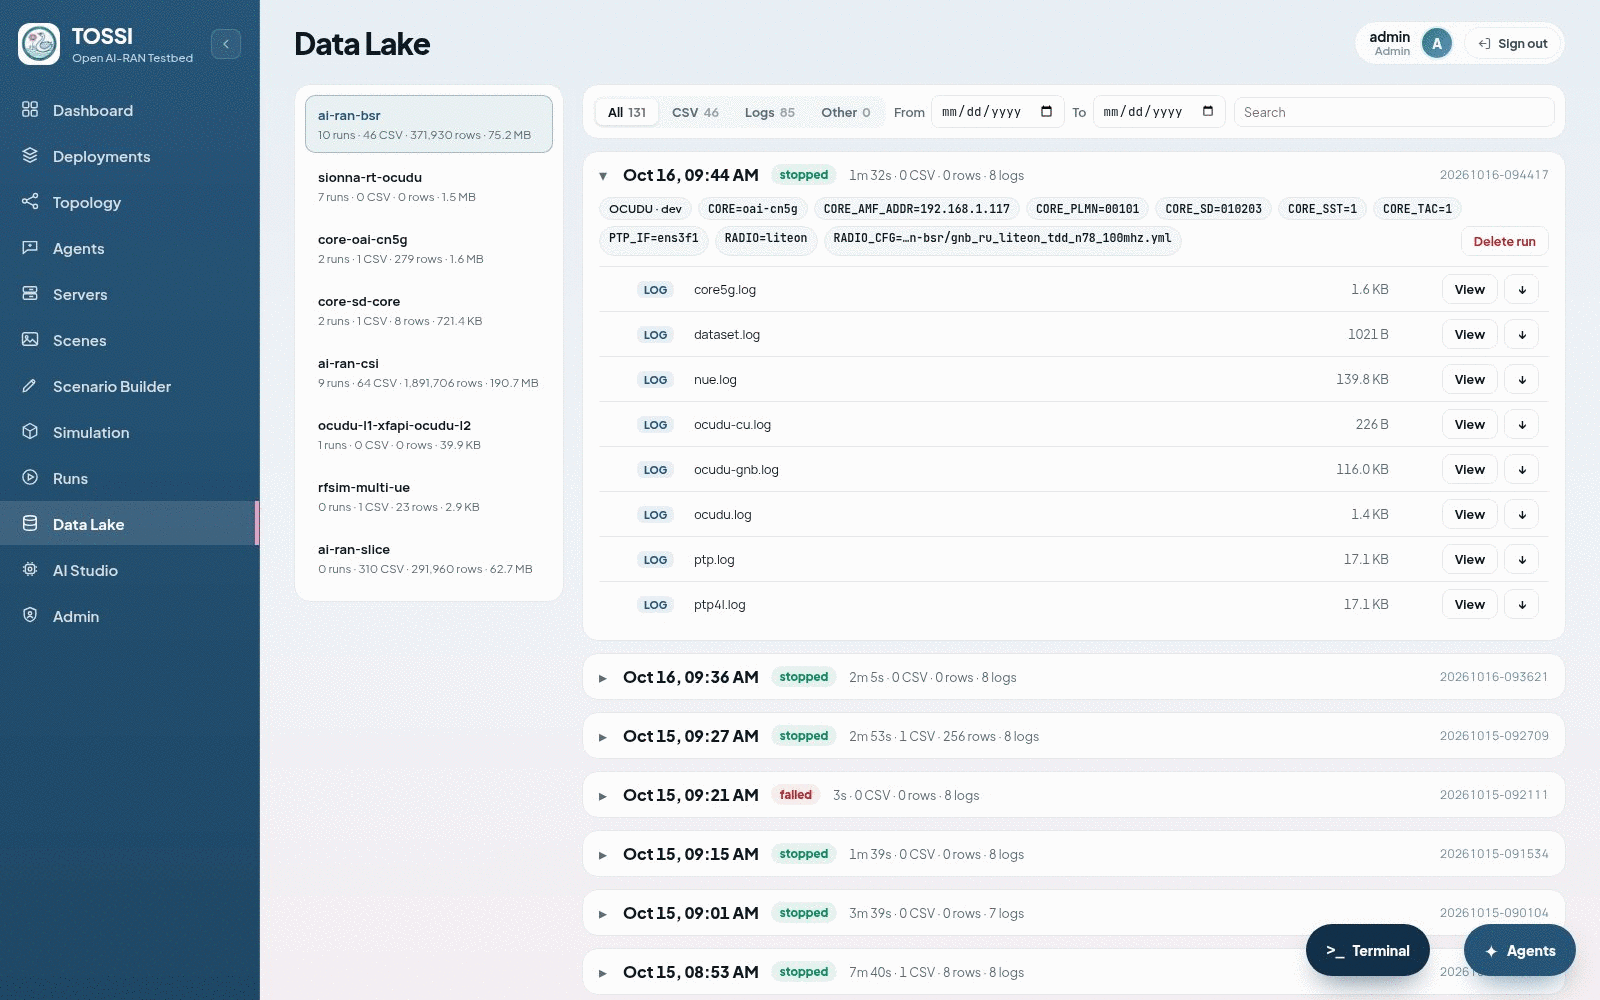
The Data Lake page. A left column lists one entry per stack with the number of runs, CSV files, rows and total size each has produced. The selected stack expands into its runs, newest first, each showing its outcome, duration, file and log counts, source branch, host and the settings it ran with as key and value tags. Inside a run, each file offers a preview of its first and last rows and a download. Filters above switch between all files, CSV files, logs and other files, with a date range and a search box.
Figure 15: Every run's datasets and logs, grouped by stack. A selection of datasets can be carried straight into training.

Training a model

Training follows the lifecycle described above.

  1. Collect. Set the stack's ML mode to collect and deploy it with a receiver attached and traffic flowing. Repeat across several runs with varied conditions. Stop the stack so the run closes and its datasets are registered.
  2. Train. Filter to the stack, select the datasets, and start training. All selected files must come from one stack. Training is requested through the ML agent, which calls the training action with exactly those files and records a benchmark against the baseline.
  3. Shadow. Set the mode to shadow and redeploy, then compare the model against the baseline in the DU log.
  4. Closed loop. Only once the model beats the baseline, set the mode to closed-loop.

There is no separate promotion step. Promotion means changing the mode and redeploying, and each stage requires an explicit approval. Training is placed automatically on the best available GPU server, with the model file copied back on completion.

The equivalent from a shell:

make train STACK=<stack>                              # every dataset in the source tree
TRAIN_SET=/path/to/list.txt make train STACK=<stack>  # one dataset path per line
DRYRUN=1 make train STACK=<stack>                     # show the steps only

An externally trained model can be uploaded and brought into service, provided it matches the format the predictor expects. It is copied to the path the DU loads, with the previous model backed up, and the DU picks it up without a restart.
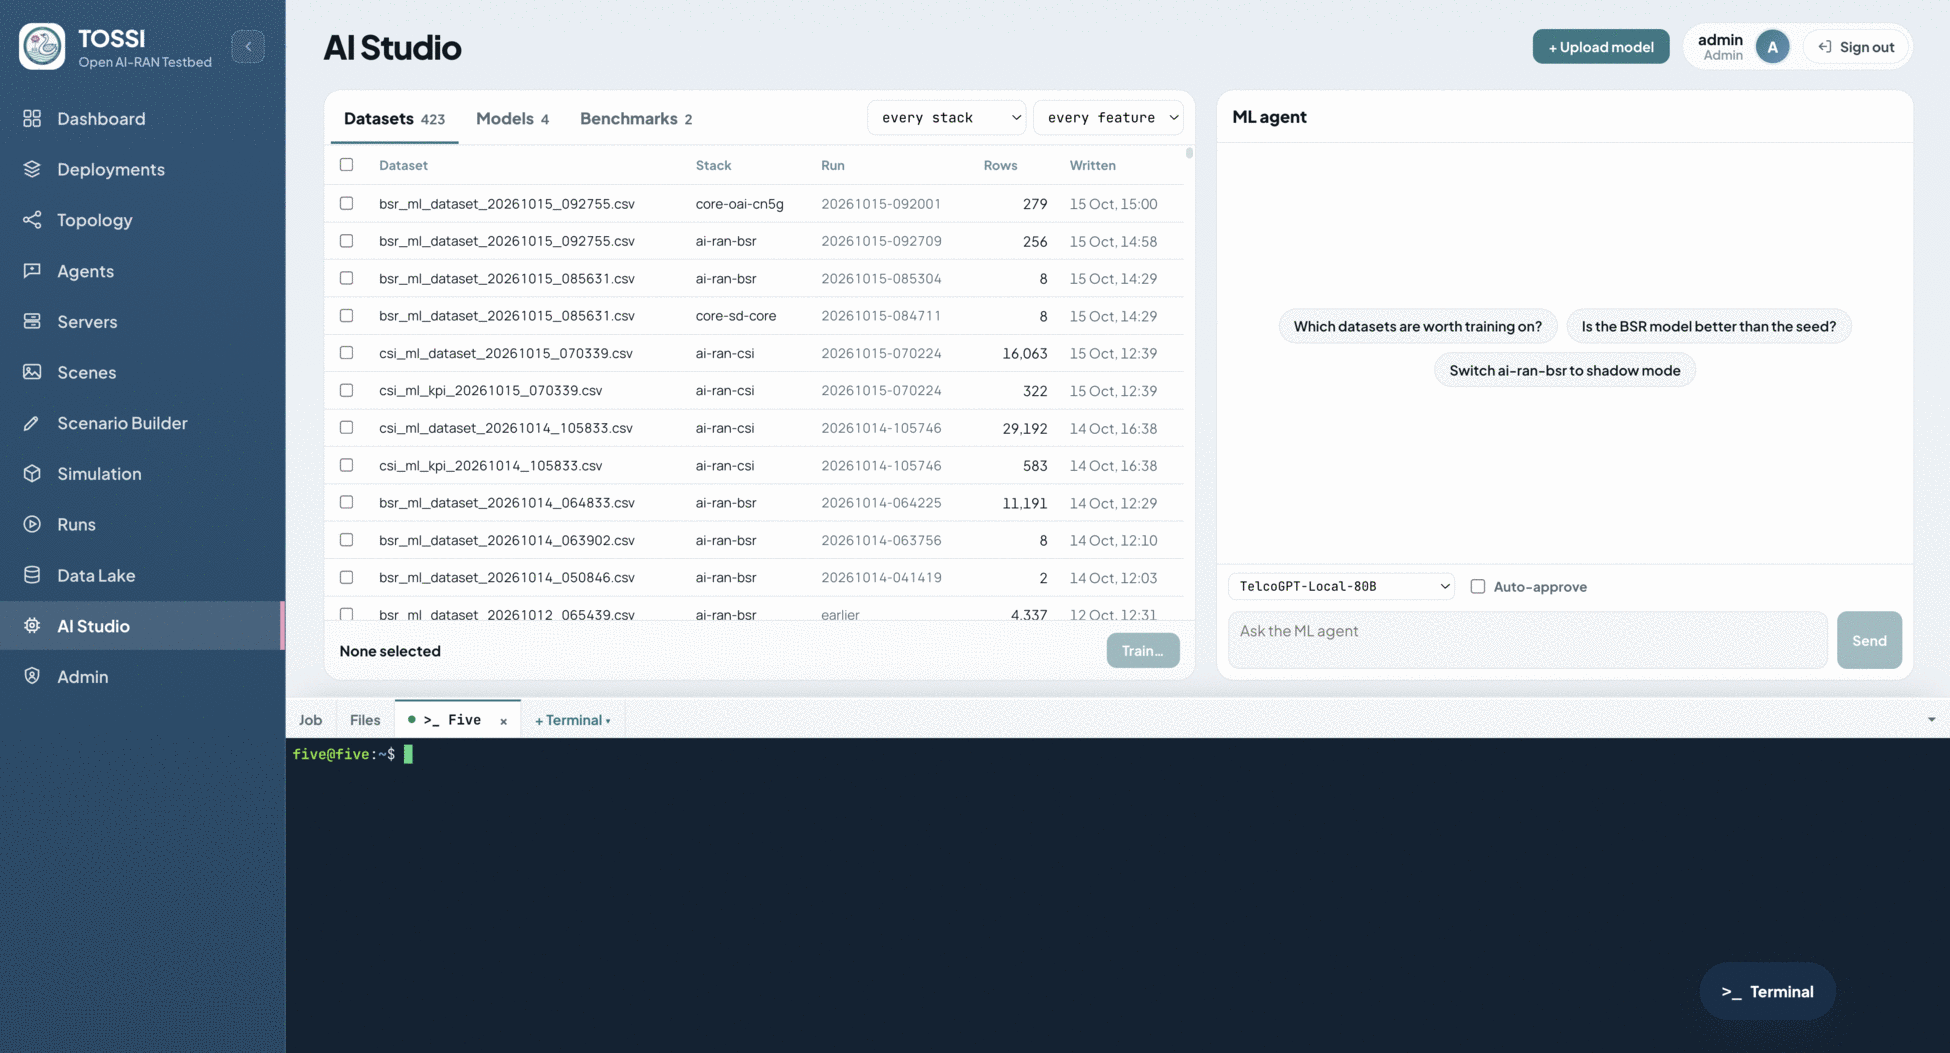
The AI Studio page. A Datasets tab lists every dataset with its file name, the stack that produced it, the run identifier, the row count and when it was written, filterable by stack and by feature, with tabs alongside for Models and Benchmarks. Checkboxes select datasets for training and a Train control carries the selection forward. A right-hand panel holds the ML agent, with suggested prompts offering to identify which datasets are worth training on, whether a model beats its seed, and switching a stack to shadow mode. A model selector and an auto-approve toggle sit below the agent's input box, and a docked terminal is open at the bottom.
Figure 16: AI Studio. Datasets are selected here and training is requested through the ML agent, which records a benchmark against the baseline.

Further reading

The four AI-RAN features have their own pages, each covering the model, its inputs and the results measured on the testbed:

The digital twin is covered in more depth under SIONNA RT with OCUDU RAN.

Source, automation engine and stack catalogue: TOSSI-Foundation/Open-AIRAN-Testbed, branch main.